


Everyone craves certainty. Markets want to know what growth and inflation rates to price in and where interest rates are headed.
Businesses want to know whether tax rates and regulations will remain stable. Households want to know how much they will be paying for energy in a year’s time.
Unfortunately, the world is becoming increasingly unpredictable. From the Global Financial Crisis (GFC) to Brexit, what were once-a-century shocks now appear almost routine. Who was predicting a global pandemic that would kill millions? Who could have forecast another major war on European soil? This article explores how the art of making effective policy choices needs to adapt to the new age of uncertainty.
We’re certain: uncertainty is growing
First, it’s not just an impression: uncertainty really does seem to have increased. A group of American academics has compiled a measure of economic policy uncertainty for countries around the world, including the UK. Each month, they count the number of articles in 11 major British newspapers that contain keywords relating to economic uncertainty and then apply some statistical wizardry to ensure the data are comparable on a like-for-like basis.
The chart below shows that economic policy uncertainty has indeed grown over time. The higher the value, the higher the level of uncertainty, at least on this measure.
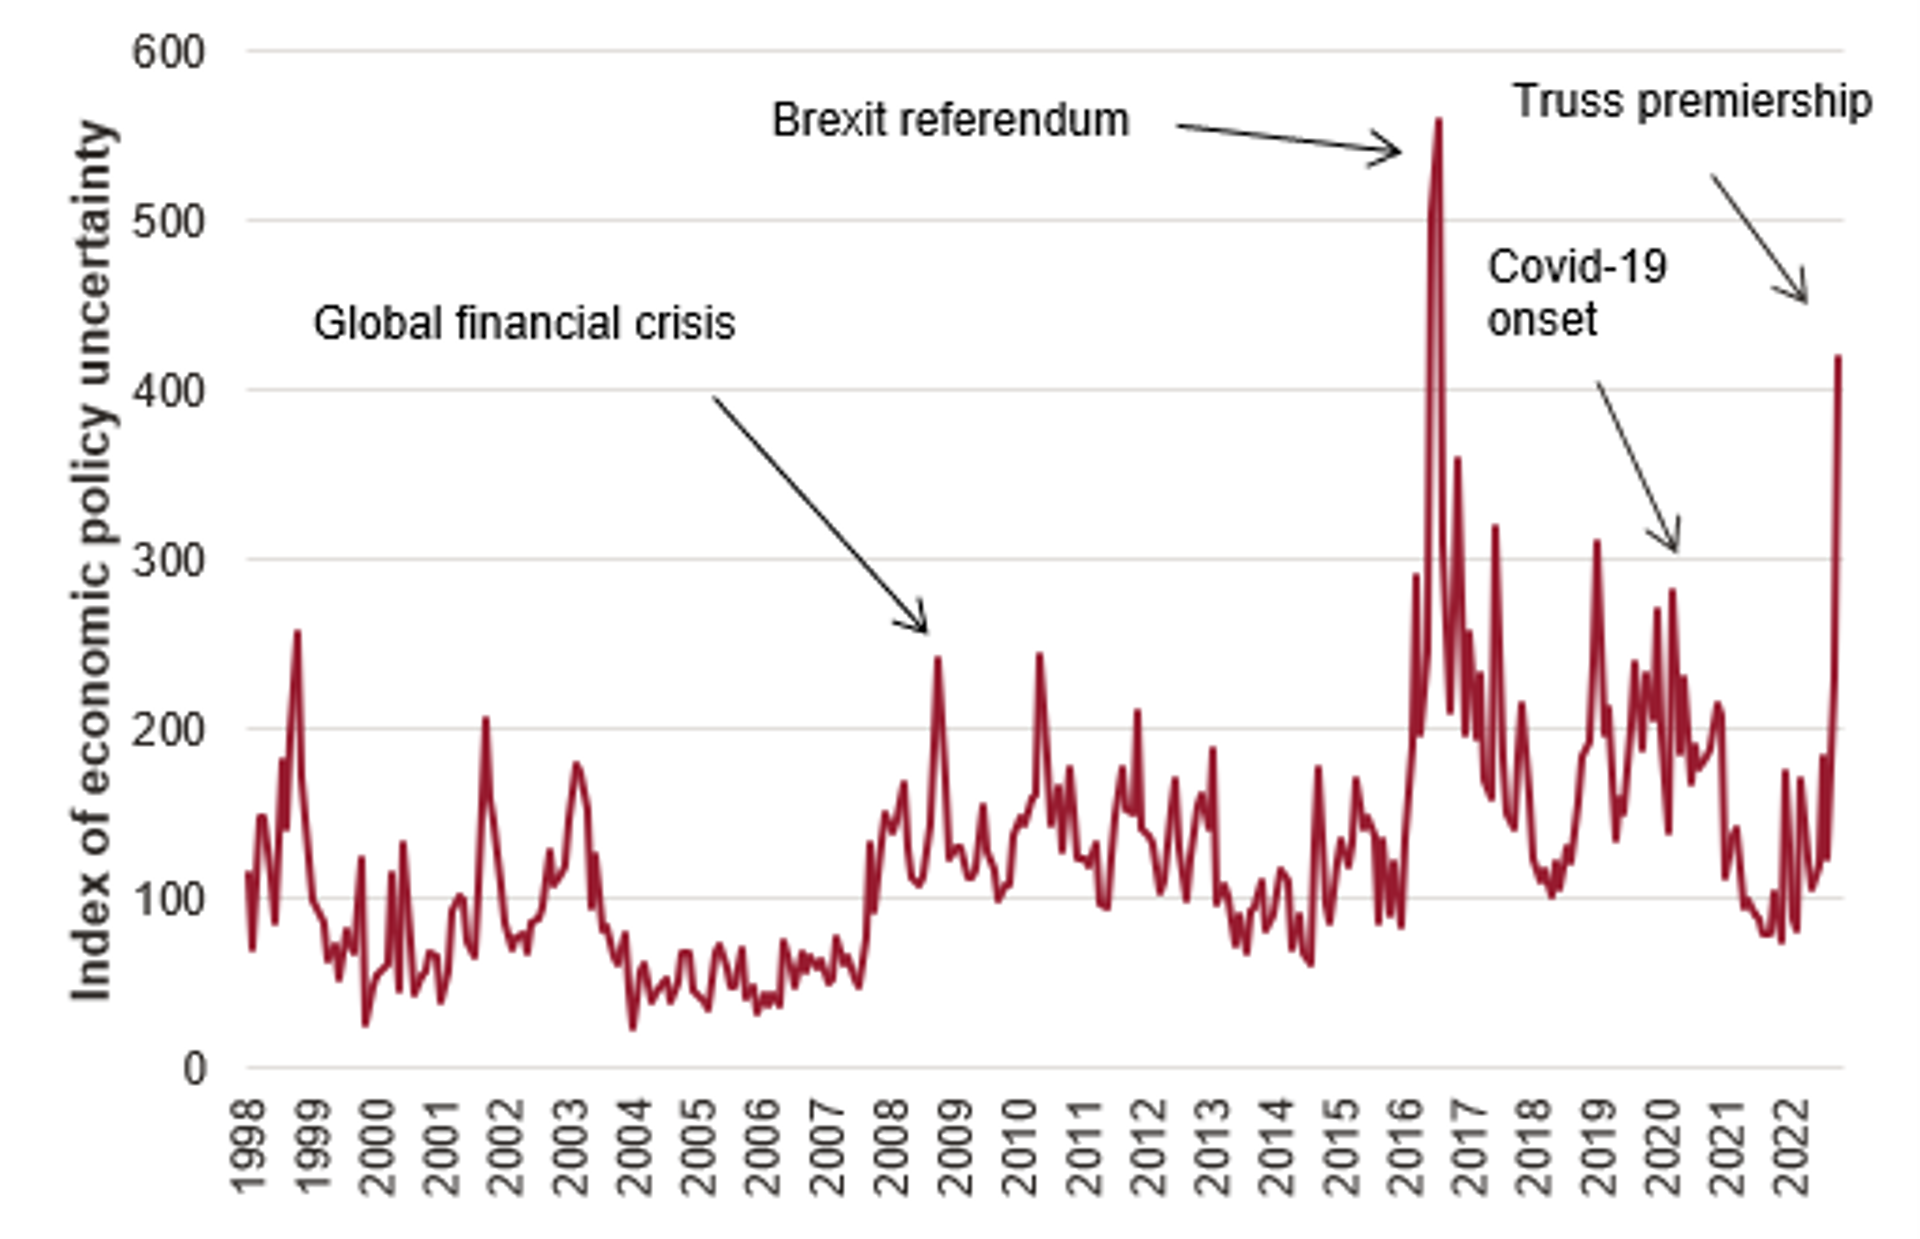
The data shows that the average measure from 1998 to 2007 – before the GFC – was 83.0. But from 2008 to 2022, it was 155.6 – almost twice as high. And if we just look at the period from 2016 onwards, the average measure of policy uncertainty is 186.9, well over twice as high as it was pre-crisis.
You can clearly see in the chart how some big news events played out. What’s interesting is the relative impact of these episodes. At the time, the GFC was the deepest recession in living memory, but the Brexit referendum in 2016 generated much more economic uncertainty. And while Covid-19 triggered an unprecedented political response in the form of massive public spending and lockdowns, the pandemic caused less economic policy uncertainty than either the Brexit referendum or the brief, turbulent premiership of Liz Truss.
Intriguingly, increased policy uncertainty seems to be translating into greater instability in some of the key variables that policymakers worry about. Inflation, for example, has surged in the past year. Supply chain disruptions, recovery from the pandemic and Russia’s invasion of Ukraine have combined to produce double-digit inflation for the first time in a generation.
Forecasting is not for the faint-hearted
Inflation is not only high but it’s also been much harder to predict. It turns out that policy decisions have been made on the back of forecasts of price increases that have proved to be too optimistic. This is shown in the chart below. The vertical axis depicts the projection by the Bank of England (BoE) of CPI inflation if interest rates evolve in line with market expectations. The horizontal axis shows the quarter that is being forecast. The lines represent the different times the projections were made, with earlier forecasts in darker colours.
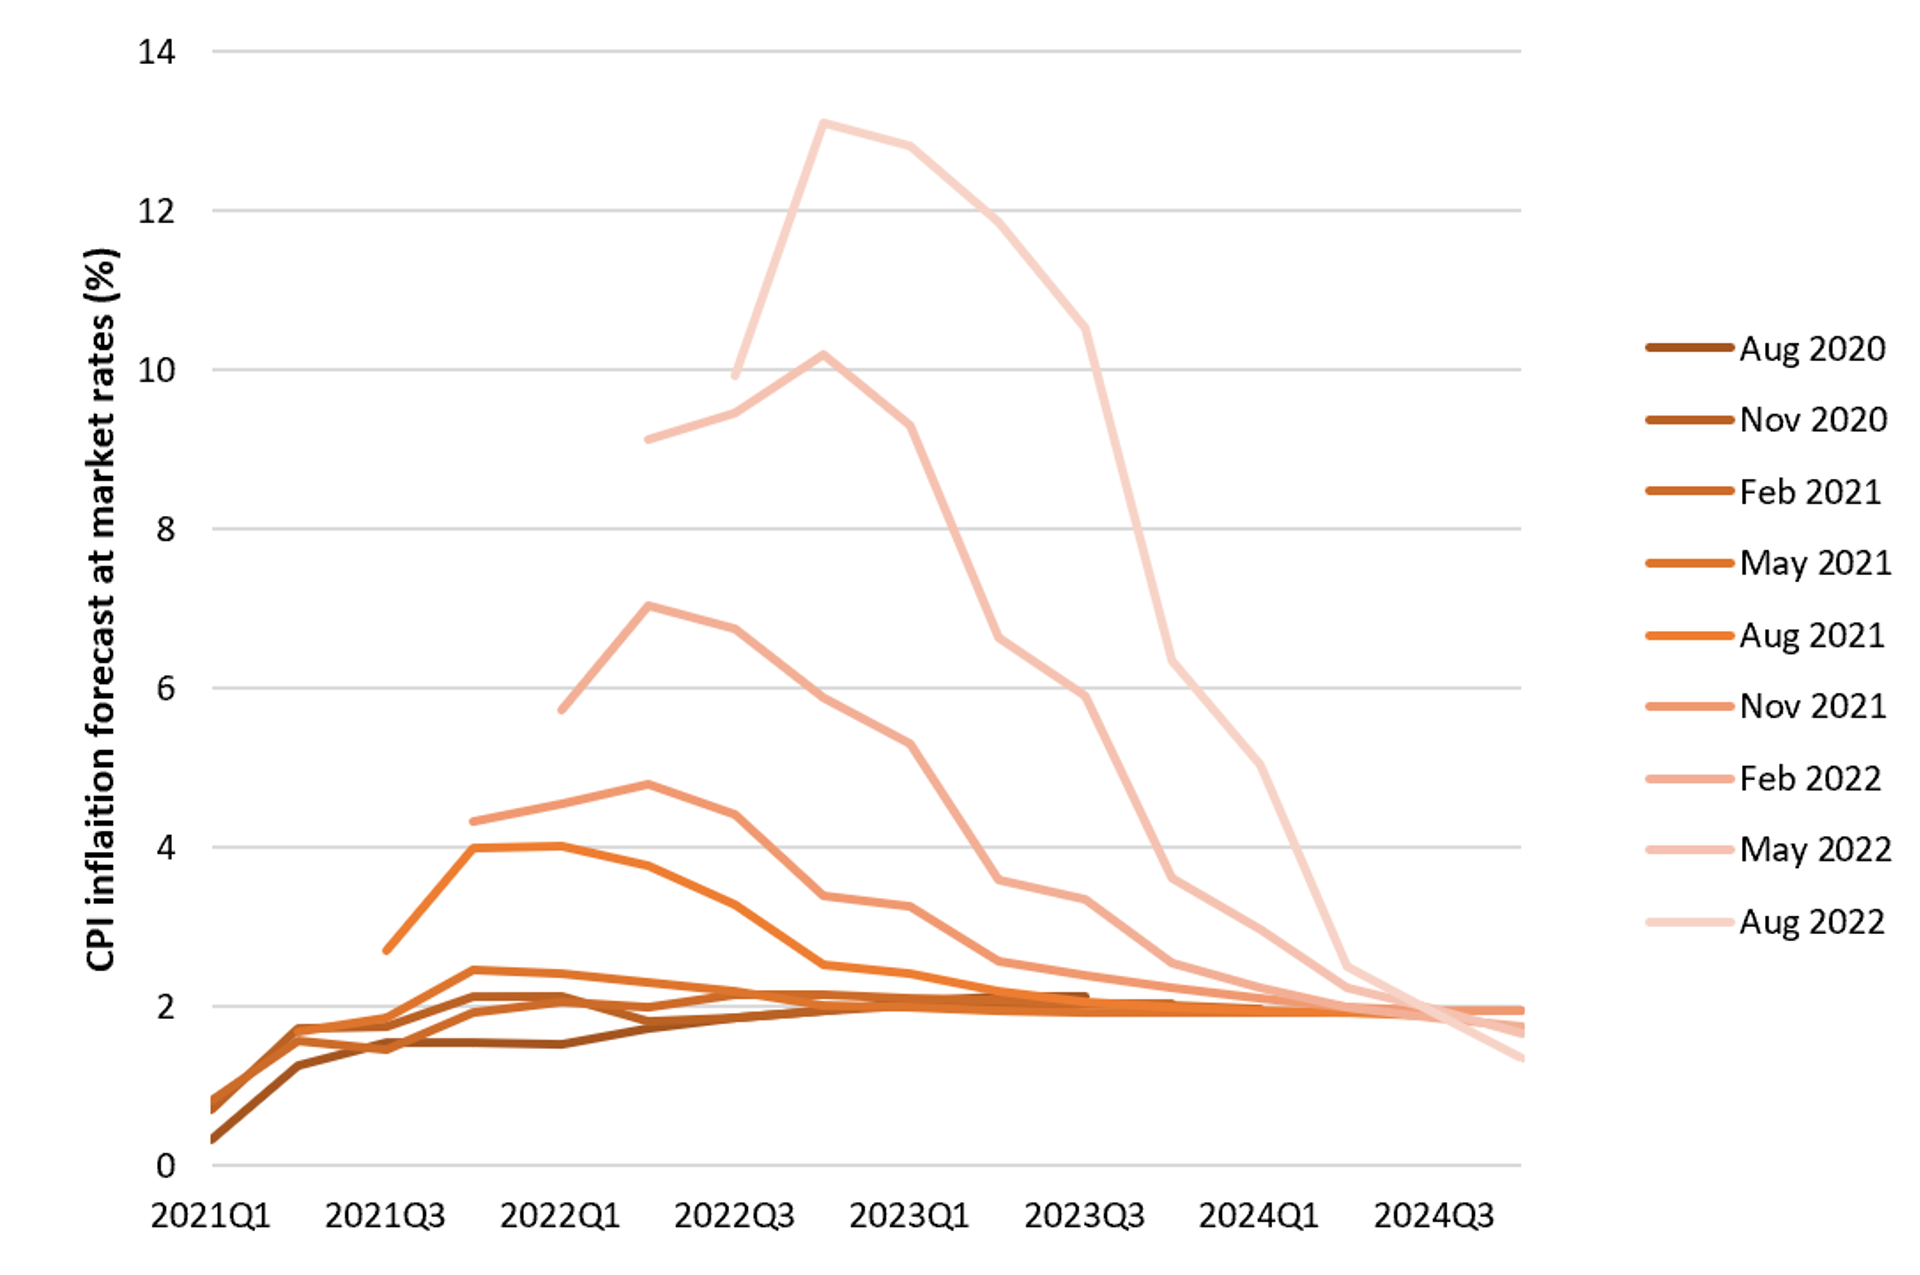
In late 2020 the Bank was optimistic that inflation would be less than 2% in the second half of 2022. By late 2021 the forecast had risen to around 4%. But by the middle of 2022 it was clear that inflation was going to exceed 10%. Note, however, that all the forecasts converge again on inflation at 2% – the BoE’s target – in two years’ time.
The pattern seems to be the same for other key variables such as productivity growth, the elixir of rising living standards. Productivity growth in the UK has slowed down since the financial crisis. (We’re still not quite sure why, though a lot of research is being done on the subject.) Nevertheless, for many years the Office for Budget Responsibility (OBR) tended to predict that, within a few years, the trajectory of productivity growth would resume its pre-crisis path. Only more recently did the OBR revise down its medium-term assumptions about the variable, but it still projects a return to higher productivity growth in the longer run.
Optimism bias is not universal. On the contrary, policymakers and leading forecasters seem to have been systematically pessimistic about how quickly the price of renewable energy would fall, as colleagues in our Energy Practice recently explained. They compared price forecasts per MWh for key renewables technologies like solar and offshore wind made by the UK’s energy department, BEIS, with auction-clearing prices observed in practice. The gaps are massive: for example, compared with forecasts made in 2011, the price of offshore wind in 2020 was more than £80/MWh lower than forecast. As the authors put it: “Even though BEIS’s cost forecasts have been repeatedly revised downwards, and despite the fact that forecasters include ‘learning rates’ in their projections, observed prices have been dramatically lower than expected.”
Poor forecasts produce poor policies
“So what?” you might ask. It’s not unusual for forecasts to be way off. Well, it does matter for policies that play out in the longer run. We want to be confident that we’re making good choices and spending taxpayers’ money wisely, and that these decisions are robust in the face of unanticipated shocks.
Take the pressing issue of climate change. Decisions taken today could lock us into longer-term outcomes with profound global implications. If serious consideration had been given to scenarios in which renewables prices fell as quickly as they did in practice, would we have made the same choices about our energy investments a decade ago?
As we put it in our previous article, if we had factored in ‘pessimism bias’ on renewables prices, we might have “… focus[ed] more on solutions where the cost reduction potential is greatest. For example, we could pay greater attention to policies that aim to the roll out standardised, modular technologies, that are being rolled out globally, rather than ‘grand projects’ that require major infrastructure programmes or bespoke designs.”
Or take the investments in innovation, skills and infrastructure that might help address the slowdown in productivity growth. If the systematic message from forecasters is that things will get back to normal within a couple of years, policymakers have less of an incentive to respond than if the risks of a protracted slowdown had been emphasised sooner.
So what can be done? A glib response is “make more accurate forecasts”. But economic forecasting is inherently difficult. The BoE and the OBR were certainly not alone in being optimistic about inflation and productivity. And forecasts are clearly needed to guide policy decisions.
While we should always be looking for improved ways of forecasting, we can also think about how forecasts are presented and framed and what messages that might send. If we go back to the BoE’s Monetary Policy Report from August 2020, for example, its infamous ‘fan chart’ for inflation forecasts for late 2022 (Figure 1.3) suggested a 90% chance that inflation would be between -1.5% and +5.5%. That’s a pretty wide range, but it still missed the mark by a huge margin. At the last count, inflation was still in double digits.
To be sure, the Bank gave itself some wiggle room: 90% is not 100%. But scant attention is paid to scenarios outside the box when forecasts are presented in this way. Instead it might be useful for forecasters to explain what might produce outcomes well beyond the range of any confidence bands for their projections. What are the factors driving the forecasts? How much do things need to change to generate very different outcomes? What other disruptions might there be?
It wouldn’t be sensible to try and put odds on any of these eventualities. But setting out the conditions under which outcomes would be very different would allow political judgments to be made about how much weight to attach to them.
Planning policy for extreme cases
The onus isn’t just on forecasters, however. The economic and business cases underpinning long-term policy choices will need to reflect the costs and benefits of the policy over many years. In a world of increased uncertainty, decision-makers need to pay more attention to extreme scenarios to stress-test choices that are made.
“What if” questions can be helpful in this connection. What do we need to believe about certain variables or assumptions that would lead us to different choices? How confident are we that states of the world where our choice turns out to be a bad one won’t come about? Providing a clear narrative around this can help both in making choices, and in defending them later.
More broadly, a world of increased uncertainty might lead to some policy choices that explicitly seek to mitigate against it. This cuts across a whole range of policy issues.
- Should we increase spending which in part insures against extreme events? Politicians are often reluctant to plan for ‘black-swan’ events, but in an age when the once unthinkable is becoming all too thinkable, that calculus might just change. Investment in climate adaptation or pandemic preparedness are two obvious examples. At the very least, updating the National Risk Register, which has not been updated in over two years, would be a useful starting point.
- Do we need to look at increased diversity of trading arrangements in the face of geopolitical tensions and uncertainties? Would favouring broader but shallower arrangements be preferable to narrower but deeper ones?
- Can we invest more in real-time data which helps address fast-changing circumstances and adjust policy as we go? The pandemic emphasised the value of knowing what was happening now, rather than waiting months or years for ‘official’ statistics. While there is always huge value in high quality data, there are inevitable lags. What more can be done with commercial and web data, for example, to inform policy design and evaluation?
Authors


He has more than twenty years’ experience in the analysis of government policy. He is an expert in using quantitative and qualitative evidence to understand and evaluate the impact of policy reforms. He joined Frontier in 2013.
View profile