


But what do we mean by fair?
The recent wave of ‘Yellow Vest’ protests in France brought to the fore the dilemma constantly facing democratic governments: how to spread out tangible short-term pain in pursuit of longer-term, more widely distributed gains. For the demonstrators, President Macron’s proposed fuel tax, aimed at meeting the goals of the Paris climate change accord, imposed too heavy a burden on the ‘just-about managing’ in small-town and rural France. With public opinion firmly against him, Macron buckled and cancelled the tax. The issues are complex, but drawing on insights from economics about the “fairness” of similar reforms might have avoided the confrontation in the first place.
When policymakers turn to economists for advice, their questions often revolve around issues of efficiency. For example, what are the market failures or barriers that prevent a desirable outcome being reached? What might be an appropriate policy response?
But even if there is a sensible economic rationale for a particular reform, the chances of it being implemented can hinge more on fairness grounds. Who exactly receives the benefits? Who bears the costs? And what politicians, commentators and the media mean by fairness often changes depending on the policy in question.
Besides the striking example of the French fuel tax protests, two quite recent initiatives to try and simplify the UK’s tax system are illustrative.
- In the 2012 Budget, then-Chancellor George Osborne attempted to pass a measure which would have charged 20% Value Added Tax (VAT) on all hot takeaway food. This would have tidied up a small part of the notoriously messy VAT rules but meant taxing baked products that are sold hot but sometimes eaten later cold. This was quickly dubbed the ‘pasty tax’ by the press and denounced as an unfair tax hike that targeted ‘ordinary people’ who are fonder of pasties than the well-off are.[1]The measure was dropped.
- In the 2017 Budget, Chancellor Philip Hammond announced an increase in National Insurance Contributions – a tax on earnings – for the self-employed which would have brought their rates closer to those paid by employees. While this has long been advocated as an economically sensible reform to align the tax treatment of different forms of earned income, the increase was quickly reversed after it was denounced as unfair because the self-employed have fewer labour rights than employees.
So fairness is a very tricky issue for policymakers to navigate. While the politics of what may or may not be deemed fair are always hard to predict, economists can at least offer some insights into how fairness considerations can be built into policy-making.
More often than not, fairness is thought about in terms of redistribution – whether or not a policy change has a greater effect on richer or poorer people. But how is this measured? The most common approach is microsimulation. The UK Treasury now routinely publishes analysis of reforms using this approach with each Budget. Household income is usually used to define rich and poor. The impact of a policy, or set of policies, on incomes is estimated for a sample of households, drawing on large-scale survey data. This identifies individual ‘winners’ and ‘losers’. Average gains or losses are then measured as a share of income for groups of households lined up from poorest to richest. A ‘progressive’ reform generates higher average gains (or smaller average losses) for poorer households than richer households, while a ‘regressive’ reform does the opposite. And quite often progressive and regressive are equated with ‘fair’ and ‘unfair’ reforms.
Take for example the chart below, which comes from Frontier’s recent work for the BBC exploring options to reform free TV licences for over-75s. We examined the distributional impact of asking over-75s to pay for a discounted licence fee, costing every household with someone aged 75 or over an extra £75.25 per year. We used the most recent large-scale government income survey in the UK, the 2016/17 Family Resources Survey covering more than 19,000 households, to model the cost as a share of total income for each affected household. We then lined them up into ten equally sized groups (‘deciles’) from poorest to richest and looked at the average losses within each group.[2]
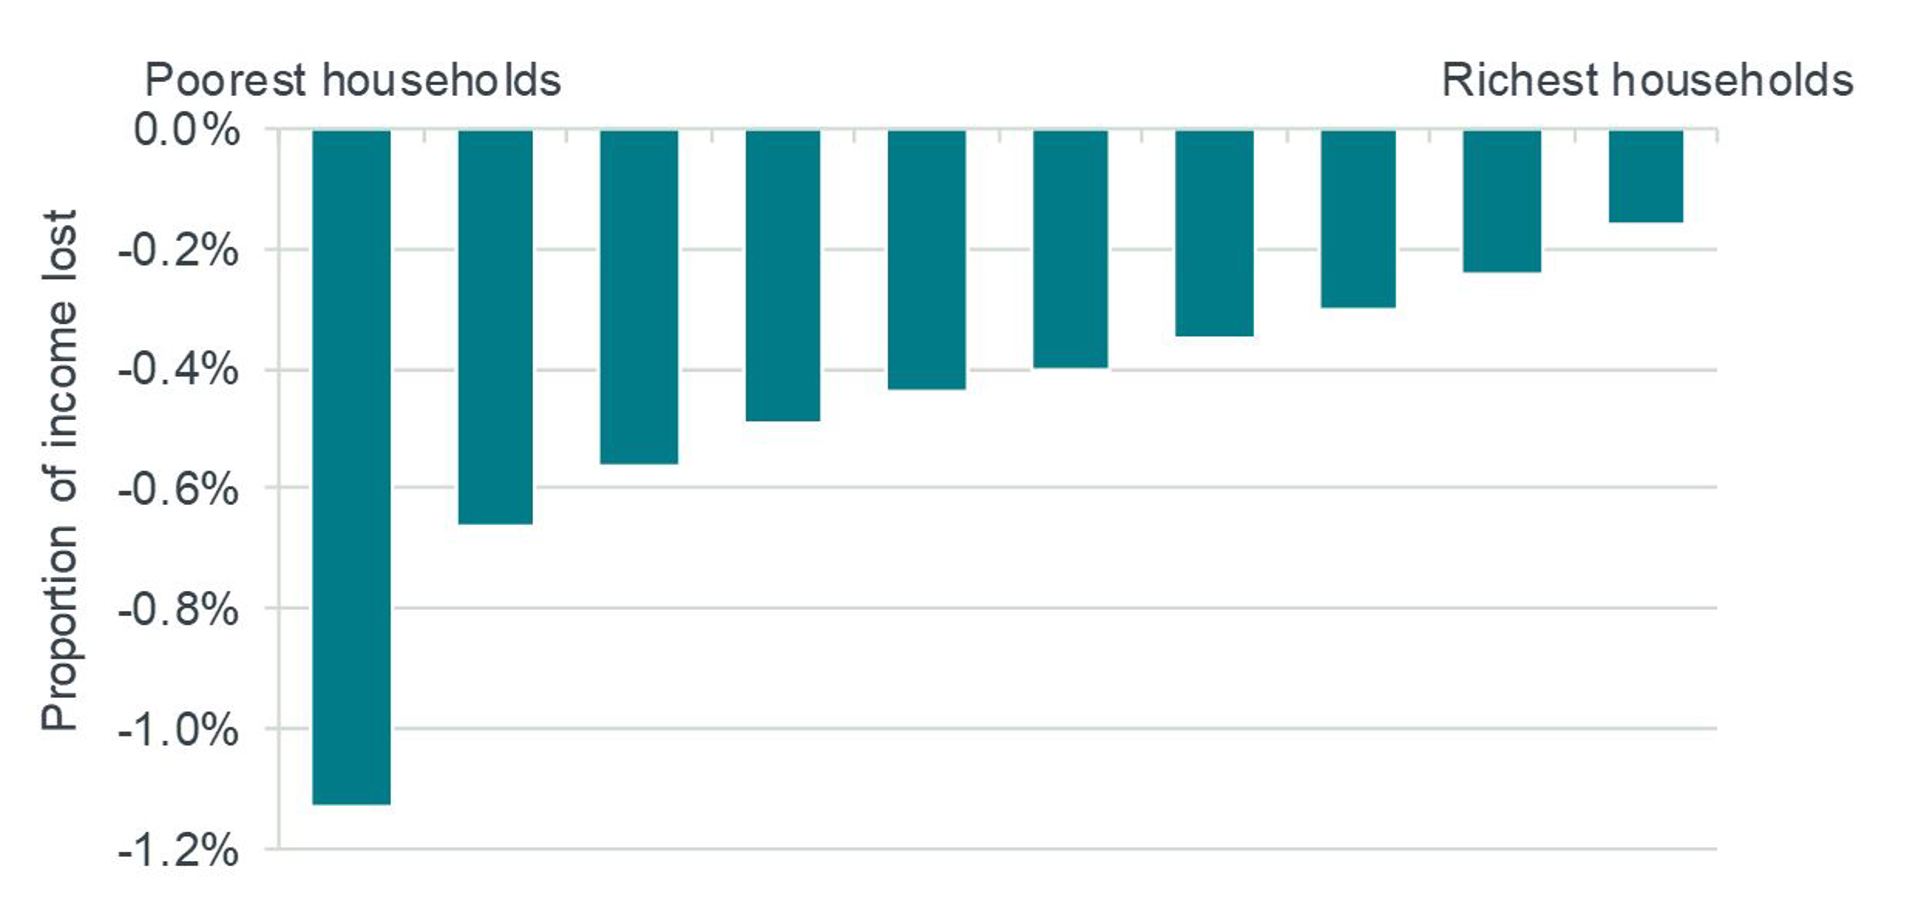
Our analysis showed that this change would be mildly regressive – costing the poorest over-75s around 1.1% of their income, compared with a loss of less than 0.2% for the richest over-75s. But of course this is unsurprising: the cash cost is the same for all households, so it must be a bigger share of income for poorer over-75s.
Does this mean the change would be ‘unfair’? This question raises lots of issues, but here we focus on three insights from economics.
Insight 1: Income might not measure what we want it to
First, what we really ought to care about is how a reform affects the distribution of living standards (what economists often refer to as ‘welfare’). And income is an imperfect measure of living standards. The data provide a snapshot of income. But a whole host of factors – health, freedoms, relationships and so on – will combine to determine how well-off someone is. It’s not just about how much money comes in each week.
Even if we accept that we need some snapshot measure, income may not be the best choice. Incomes are noisy, both over the short term (unexpected gifts, casual earnings from secondary jobs, promotion or job loss) and the longer term (moving from education to work to retirement). Many people try to insure against unexpected swings in income by saving and borrowing. This has led many economists to choose household spending as a better measure of living standards than income, the idea being that what we spend draws on this saving and borrowing to smooth out changes in income and thus maintain a more consistent standard of living over time.
What happens if we look at the same BBC policy reform but divide over-75s into rich and poor based on spending rather than income? We still see a slightly regressive impact, but the difference between the impact on poorest and richest households is reduced quite a lot (see chart below).
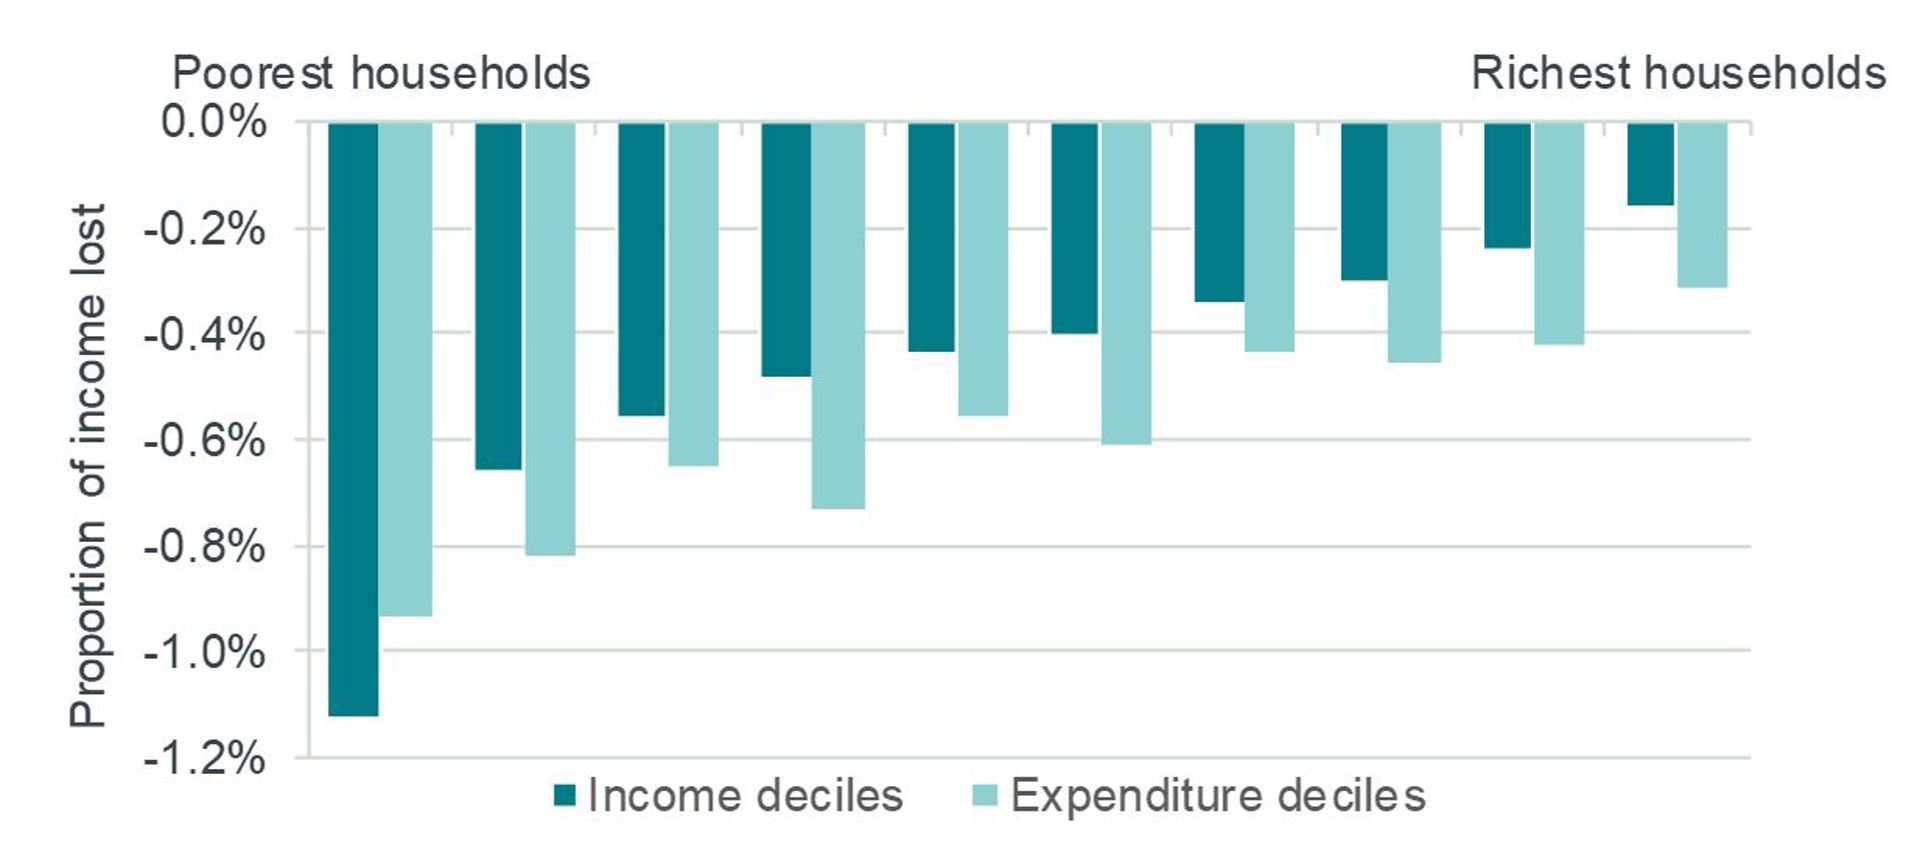
In other contexts, moving from an income-based to an expenditure-based distributional analysis can profoundly affect the ‘fairness’ argument. For example, the Institute for Fiscal Studies has previously recommended extending VAT to virtually all goods and services in the UK and compensating poorer households through targeted tax and benefit reforms. When the distributional impact of the overall package of changes was assessed on an income basis, those in the bottom third of the income distribution were, on average, cash losers. But when the analysis was applied to household spending instead, the richest third were the losers, with poorer households gaining.
Insight 2: Benefits can be harder to measure than costs
The second point is that a policy reform is rarely implemented in isolation. A true sense of fairness really needs to look at the whole package. But this can often be difficult; indeed, in some cases trying to put an income value on parts of the package can be near impossible.
Take the BBC licence fee example once again. If the BBC were to re-introduce the fee for some or all over-75s, the impact would likely be larger for poorer, older households. But what else would happen? The additional licence fee income from over-75s would be spent on something – more and higher quality programming, for instance. But measuring who benefits from this and the value they get from it is much, much harder than gauging the cost of paying the extra licence fee. Would our assessment of the ‘fairness’ of any reform change if we could measure and value the benefits as well as the costs? It’s hard to say, but it seems unlikely the distributional picture in the charts above would remain unchanged.
Insight 3: Fairness goes beyond rich and poor
Finally, while distributional analysis looking at the impact of policy changes on rich and poor has become a standard currency when discussing fairness, there are clearly many other dimensions to the issue.
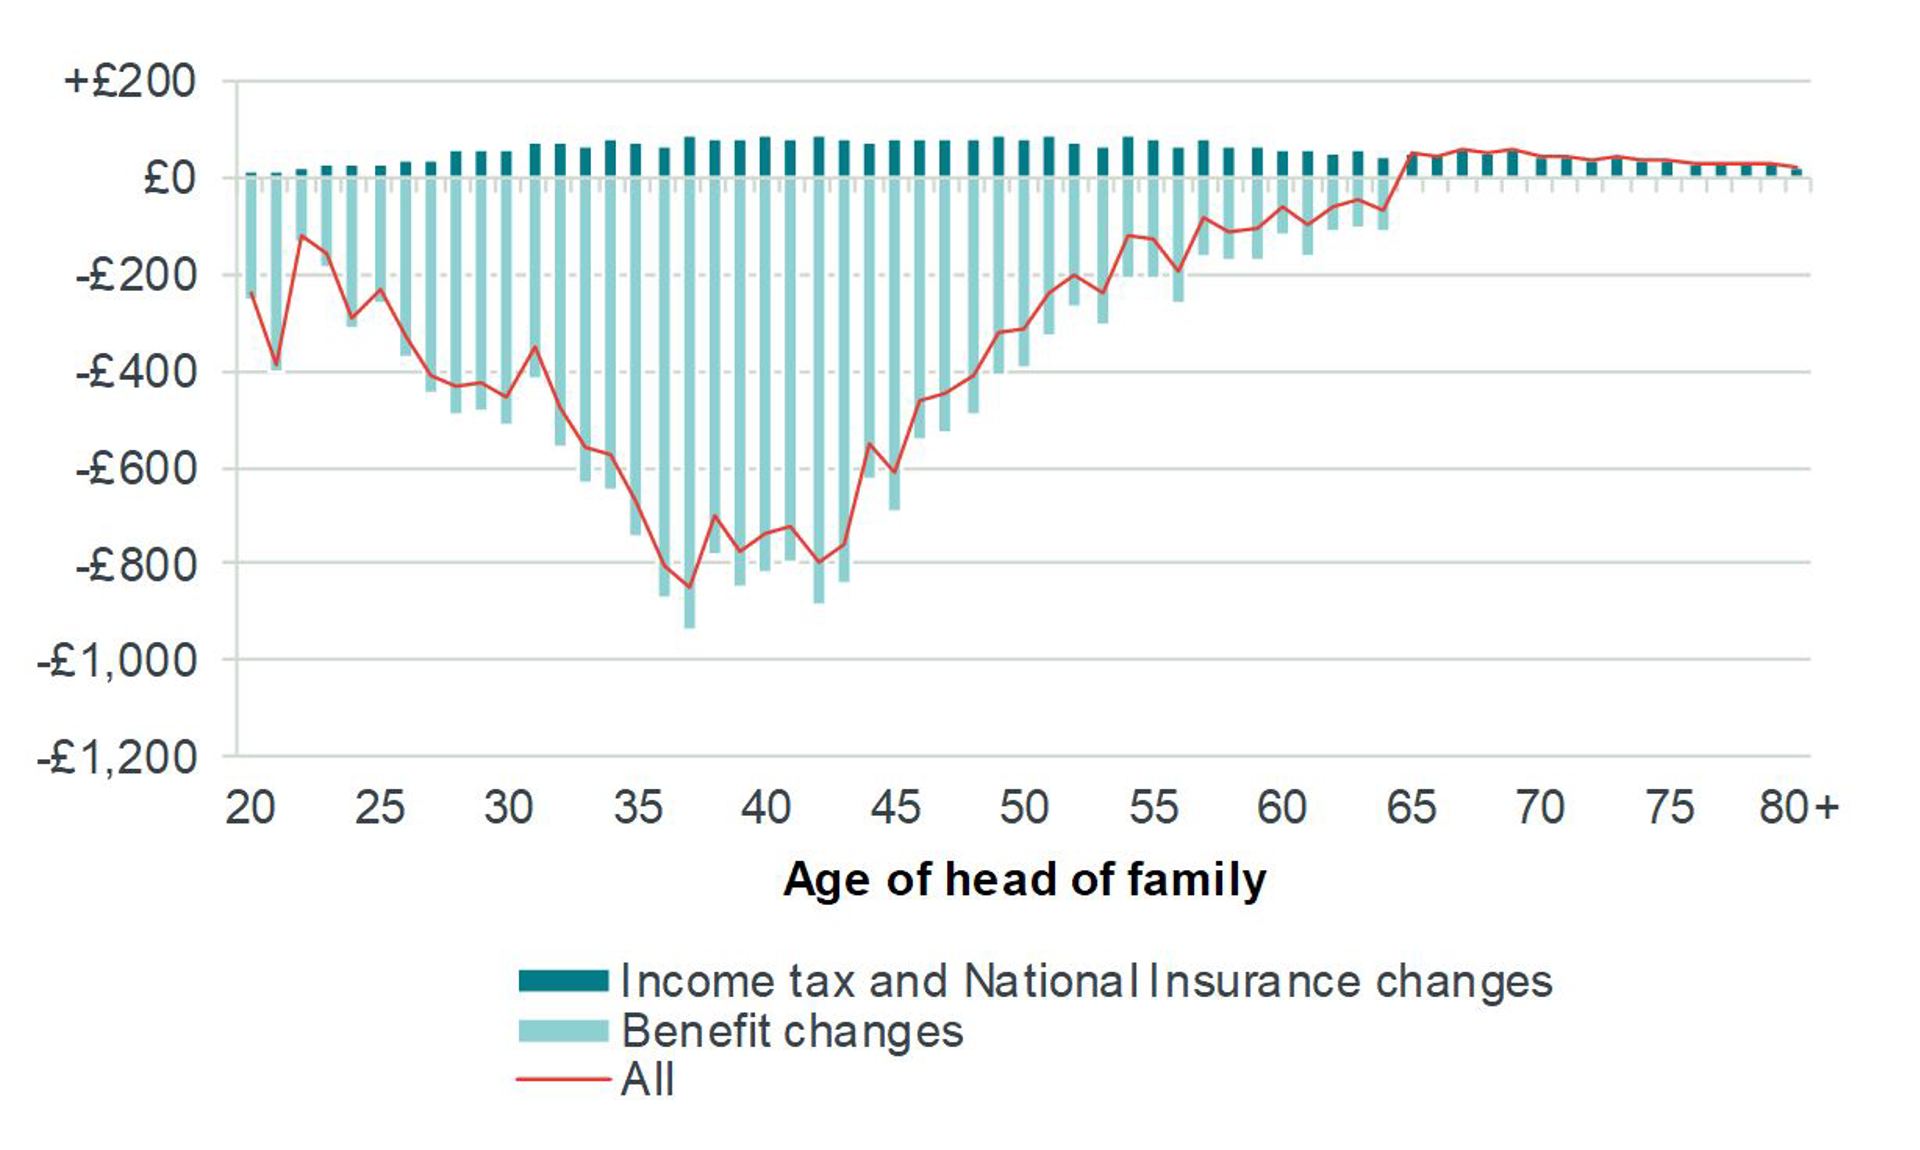
For example, much debate lately on ‘intergenerational fairness’ has centred on the impact of policy reforms on the old and young rather than the rich and poor. Analysis of recent tax and benefit changes by age has shown that they have hit working age families much harder than those in retirement (see below).
Governments might also care about how reforms affect many different groups besides the rich and poor. The Equality Act 2010 lists several protected characteristics including disability status, sex, sexual orientation and religion for which public authorities must have due regard. ‘Equality impact assessments’, which review reforms in terms of their impact on these various groups, are now increasingly common.
Conclusion
At first glance, considerations of fairness are grist to the mill of philosophers, not of economists. But remember that one of the greatest economists of all, Adam Smith, was primarily a moral philosopher. Governments and public bodies have always had to pay heed to questions of fairness and moral principle. Which groups in society are likely to be favoured, and which disadvantaged, by a particular set of tax and spending decisions? The difficult judgments that policymakers from President Macron to the governors of the BBC must make about the fairness of their policies go well beyond economics. But sound economic analysis can at least guide them to the best outcomes.
[1] For those unfamiliar with them, a pasty is a baked pastry filled with a usually savoury filling. The most famous variant is the Cornish pasty, which has protected EU status.
[2] There’s lots of nuance in how you measure income which we’ll gloss over, but the details are in Frontier’s report. The main point is that we followed established best practice – in particular, adjusting income to take account of household composition, a process known as ‘equivalisation’. This reflects the fact that £100 goes further for a single adult than it does for a couple with two children.
Authors

He has more than twenty years’ experience in the analysis of government policy. He is an expert in using quantitative and qualitative evidence to understand and evaluate the impact of policy reforms. He joined Frontier in 2013.
View profile