


THE MEASUREMENT OF WELL-BEING AND ITS USE IN POLICY
The concept of happiness has a long, if patchy, history in the canons of political philosophy. It was not until the 21st century, however, that its modern articulation, “subjective well-being”, began to be taken seriously as a policy objective. Today over 30 countries measure “life satisfaction”, and traditional measures of economic success such as Gross National Product are being challenged by broader measures, not least because governments have come to suspect they may give better guidance as to their chances of re-election. Over Frontier’s lifetime, these measures have progressed from the world of wacky political ideas to mainstream policy-making, and economists are having to rediscover some of their basic concepts to keep pace.
Over 2,000 years ago, Aristotle was focused on “eudaimonia” as life’s proper objective; but it was in the late eighteenth century, in the advanced political environment of a newly independent United States, that “the pursuit of happiness” became formally enshrined in a constitutional document. At much the same time Jeremy Bentham was developing the concept of utilitarianism, which economists made the bedrock of much of their analysis. Classical economics rested on the premise that individuals would try to maximise their “utility” (aka happiness or well-being), and that governments should seek to maximise the utility of the nation as a whole.
During the Great Depression in the 1930s, however, Simon Kuznets developed the seventeenth-century invention of national accounts into a concept that would become the dominant measure of economic success – Gross Domestic Product, or GDP. It would be used in ways he never intended, since he – unlike many who adopted his measure – clearly understood that it gave a (useful) reading of national activity but not national well-being.
Since the 1930s, governments worldwide have collated increasing amounts of data on national income, output and expenditure that would enable them to pronounce on whether their economies were enjoying growth or suffering recession. GDP was the most important driver of so much that mattered to governments, not least the amount they were raising in tax, so the obsessive focus on this number was understandable – and yet its limitations were also self-evident.
GDP is an objective, monetary measure that gives us no direct evidence of how good it makes people feel. It ignores how incomes are distributed; and it is totally deficient of some critical elements in human well-being, namely those “externalities”, like a clean environment, that do not have a market price. Not only may increments to GDP have different effects on well-being depending on who gains from them, but even after allowing for distributive effects, the correlation of income with happiness is far from clear.
ASKING THE QUESTION
So how do governments set their objectives? And how do they know if they are succeeding in meeting them? Over the past 20 years, they have of course had a range of objectives. But in the main, the key ones have been more or less related to economic growth (i.e. increasing GDP). To take the UK as an example, lowering taxes, cutting the deficit, privatising slow-moving state industries, getting a grip on inflation – all were seen as ways of improving Britain’s growth performance.
Government objectives beyond that have tended to be couched in terms of general aspirations about “freedom”, “fairness” and “opportunity”, while we economists continued to build our models on the theory of utility maximisation, but never made much effort to measure it, match human behaviour against it, or convince governments that this was a task worth doing. So the question – “what constitutes success?” – has remained not just difficult to answer, but almost entirely unanswered.
Politicians’ private, if not often public, answer would often be simple: “success is getting me re-elected”. The problem is that the GDP-based measures on which they had come to rely gave pretty little indication of whether they were succeeding on this private agenda, either.
It was generally supposed that economic growth made people feel positive about incumbent governments, that high and rising unemployment made them feel negative, and that in an economy like the UK, with high levels of home ownership or rather home purchasing, the mortgage rate would be a powerful factor too. But the evidence suggested that a much more complex financial measure such as real personal disposable income was needed to “explain” voting patterns, and that some more comprehensive measure of well-being might have greater explanatory power, anyway.
Of course governments, as they come to power, have broader aspirations, peculiar to the exigencies of their time or their own philosophy, for which there may be different success measures. Box 1 illustrates this diversity from the preoccupations of the past four British prime ministers. (The fifth, Theresa May, probably has only one – to get Brexit done.)
BOX 1
THE VISION THING
When Margaret Thatcher came to power 40 years ago this year, she articulated only a few strands of what came to be seen as “Thatcherism”: the reduction of trade union power, the privatisation of state industries, the liberalisation of markets and the control of public finances and inflation. Some objectives were speedily achieved (the removal of exchange controls, reductions in the top rates of tax), others took longer (privatisation, trade union legislation); some were never achieved in her time (sustainably low inflation). Such major structural changes were targets in themselves: the connections with growth were hotly debated but broadly positive, well-being measures were in their infancy, but three election victories in a row gave evidence of political “success”. (The failure that brought Mrs Thatcher down is reviewed in our article on evidence-based policy-making).
On appointment as her successor, John Major was instantly pressed for his “vision”. The key elements soon became clear: he wanted desperately to bring peace to Northern Ireland; he was determined that public services should treat their users as valued customers rather than problems to be dealt with; and he wanted a country “at ease with itself” – a country that was socially cohesive. All of these objectives embodied values that self-evidently could not simply be expressed in terms of national output: the pressure for broader performance indicators was beginning to surface.
His successor was also passionate about modernising public services, so that the ideas behind Major’s “Citizen’s Charter” got a new dimension with Tony Blair. He was strongly focused on the delivery of better outcomes in health, education and the criminal justice system – demonstrating an understanding that monetary input measures are highly imperfect indicators of success. He showed great interest in measuring progress against targets in these areas – but the targets set tended to be “intermediate” ones – hospital waiting times, exam results – rather than ultimate targets for education or health. He also wanted a world in which the good guys stood up to the bad guys, and was not the first (or last) prime minister to find how difficult that objective could prove to be.
Blair’s successor, Gordon Brown, found his distributive ambitions – to tackle poverty at home and abroad – overtaken by an economic crisis that helped to wreck government finances, leaving the coalition that followed his brief period in Number 10 unable to do little to begin with except pick up the bill. So 2010 did not seem like a great moment to try to convince an incoming prime minister to think beyond the numbers. Nevertheless, it was David Cameron who as prime minister showed the first real enthusiasm for a broader, non-financial measure of success to be developed.
If ever a final nail needed to be put in the coffin of GDP as a measure of national well-being, in the UK at least this was hammered home in 2014. That was the year in which the Office for National Statistics (ONS) announced that (in line with many other advanced economies) it would henceforth include prostitution and illegal drugs trafficking in GDP. By then, however, the ONS and many other national statistics offices had begun to redeem their reputations for good sense (or rather make clear they understood what different statistical measures were for) by beginning to collect proper data on well-being.
It was part of a global trend. The first “World Happiness Report” was produced by the Earth Institute in 2012 (see Box 3), the European Union was already collecting data in its social surveys, researchers had the Gallup World Poll to draw on, and the OECD was beginning to collate data too.
The first steps taken by the ONS were to go round the country asking people what mattered to them. The answers were hardly surprising. They cared about their health, their children and their environment; they wanted a just and fair society, and a strong rule of law. It is perfectly possible to measure all of these, at least in a rough and ready way, in order to track whether they are becoming “better” or “worse”. The problem is how to weigh the pluses on one score against the minuses on another. How do you compare better health with a decline in educational standards? The solution was to democratise analysis of the trade-offs by asking people how they felt about their lives overall.
How satisfied were they with their lives? Did they feel their lives were worthwhile? Would they describe themselves as happy? Of course there are plenty of different ways these questions could be expressed, giving different measures, and possibly different trends. The ONS ended up by selecting four (see Box 2).
BOX 2
FOUR STEPS TO HAPPINESS?
From April 2011, the ONS started asking more than 200,000 of the UK population the following questions as part of its Integrated Household Survey: Overall…
- How satisfied are you with your life nowadays?
- How happy did you feel yesterday?
- How anxious did you feel yesterday?
- To what extent do you feel the things you do in your life are worthwhile?
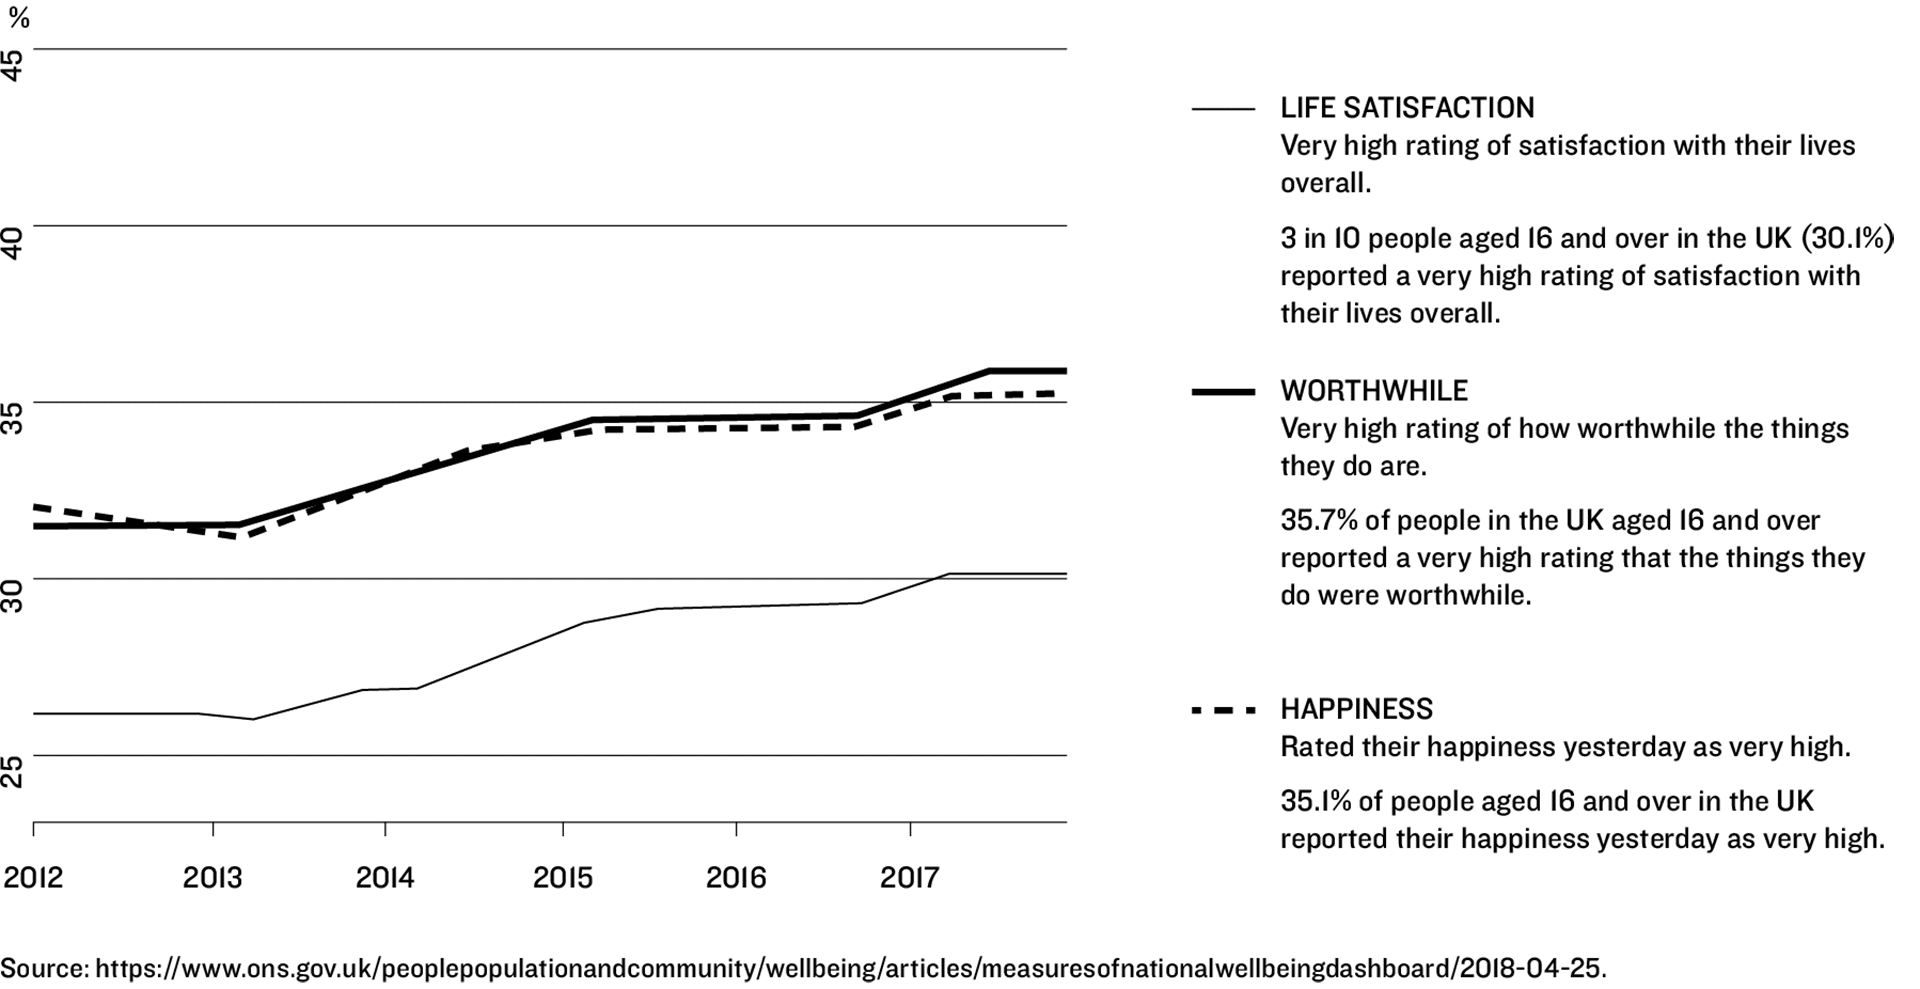
Those surveyed are asked to grade their responses on a score of 0–10, with 0 meaning “not at all” and 10 meaning “completely”. The samples are constructed to be representative at the national level every quarter, and representative of each local authority area on an annual basis. The latest annual results for three of these indicators, taken from the ONS’s National Well-being Dashboard, are shown in figure 12.1.
These charts show a broad upward trend since data collection started. But it is in the detail that we learn most about what concerns people, and how well that matches up with public policy priorities. Perhaps most challenging is the evidence these statistics provide of the high levels of stress and anxiety among the young, whose main concerns seem to be unemployment, loneliness, having someone to rely on and a lack of sense of belonging to their neighbourhood.
FIGURE 12.1: PERSONAL WELL-BEING
But does this information do anything more than intrigue us? How far are we from using these measures as a performance benchmark for public policy? What difference would it make if we did?
LOOKING THE OTHER WAY
The answer is: taking well-being seriously as an objective would make a lot of difference. And there are some areas where it already has. Health policies offer perhaps the most obvious examples, as well as the potential for many more.
Governments have for some time been in the business of measuring not just the “expectation of life” (how long we will live) but also the “quality of life” (what those extra years will be like). The UK National Institute for Health and Care Excellence, known as NICE, has developed ways of measuring the impact of a particular drug on the quality of life, an important piece of knowledge when weighing up the trade-offs between extending life and giving people a shorter but better life. And NICE has to reach a view on whether a new drug’s impact on QALYS (quality-adjusted life years) justifies its cost.
We are, however, a long way from generalising this approach to the allocation of resources to all areas of public spending. The recent increase in expenditure on mental health reflects a growing understanding, backed by surveys, of its powerful impact on well-being. But it has as yet to drive a shift from curing problems to anticipating and preventing them.
Cures are expensive, and often don’t work. Prevention is a more cost-effective way of improving well-being. If we want to save money in our criminal justice system, the best way is to stop people embarking on a life of crime rather than locking them up at periodic intervals throughout it. The crucial point is that the earlier you start teaching people how to lead successful – happy – lives, the better. So – obviously – education is a good place to start.
TEACHING FOR SUCCESS
Most education systems are measured by exam results. They are the indicator that fits with both parents’ aspirations (for their children to get on in life) and government’s need to have a measure of teaching performance. Exam results dominate school league tables, and drive parents’ school choices. But everyone knows their weaknesses: employers increasingly recognise that degree results are not a good basis of recruitment, while university admission tutors will (privately) tell you that they only use A levels as the benchmark because they are readily available and reduce arguments about who you should admit.
Moreover, data showing increases in pass rates nationally are often criticised as indicating a lowering of standards, prompting the addition of higher and more testing grades, leaving pupils and teachers with the feeling that they have to run ever faster to stand still. Levels of teenage stress on and around public exams should be a warning light that things are not going all that well.
However, moving away from exam results as the prime measure of success has problems – not least for school students, who would find themselves working hard to gain the only validation available to them and then being told it is worthless. So again it is important to stick to the underlying principle: with education, as with all other public services, we should aim to improve the quality of people’s lives, and their perception of whether it is doing so is a great guide to whether we are succeeding.
The evidence indicates that children who do well in exams feel their lives are going well, but also that the chain of causation goes both ways: happy children do better in exams, even after taking account of all the other factors that may go along with their contentment, like having more supportive parents with more resources to give that support.
So an obvious first step would be to ask secondary school pupils how they feel their lives are going, and publish the results along with exam scores. Of course there are problems with such feel-good measures, but so there are with exams, and it requires a mix of indicators (including the “value-added” scores that try to measure the degree of improvement in a pupil’s performance that is attributable to the school) to give parents a rounded picture.
There have, of course, already been some moves in this direction, with surveys of universities that focus not on reputation (or difficulty of entry) but on the quality of teaching – and that, as part of the compilations of the results within the Teaching Excellence Framework, actually ask the students about that. To only some people’s surprise, the results were extremely poor for some of the UK’s most famous institutions. By contrast, some universities much further down the pecking order were scored “gold” – which may reflect the greater effort they had had to go to attract and retain students
JOBS FOR LIFE
The same approach is beginning to creep into careers advice, but has a long way further to go. Of course students want to know what they are likely to earn in different occupations, and everybody likes a big pay cheque, but the evidence that over-long hours, stress and job insecurity in the City are burning people out is having an effect. How many young people really want to work somewhere that may hand them a bin bag and tell them to leave that afternoon?
Of course, for some young people, it’s just a question of earning enough to live, and talk of job satisfaction sounds pretty irrelevant. But for others, evidence from such surveys as the “Great Place to Work” (which Frontier has engaged in from very early on) may be quite as powerful as raw salary data.
Again, the direction of causation isn’t always easy to unpick. (Happy people seem to be better at going for jobs that make them happy.) But careful analysis can untangle two-way effects, and that analysis suggests that you can make better career choices if you know both income and job satisfaction levels for people in different careers.
BOTTOM UP?
All the evidence suggests that you get the biggest bang for your buck by improving the quality of life for those at the bottom of the pile. Unsurprisingly, international comparisons show that gains in income have the greatest effect on life satisfaction for those who have very little. But it also seems to be the case that being in employment has a more powerful effect than mere money. The link between having a job and a sense of self-worth is clear. This raises interesting questions about such policies as the labour market reforms in Germany (see our article on evidence-based policy-making), which have been demonstrated to have lowered the underlying unemployment rate but also increased income inequality.
Work by the Social Science Research Centre in Berlin (WZB) on survey data from the German Socio-Economic Panel (GSOEP) clearly demonstrated that the working poor enjoy higher life satisfaction, social integration and civic engagement than the non-working poor. However, it also warned against over-estimation: these individual and social benefits of employment critically depended on pay levels and overall job quality, so that the welfare gains achieved by Germany’s recent reforms may be smaller than would be suggested by employment rates alone. The key point this illustrates is the importance of measuring subjective life satisfaction, rather than making objective assumptions about it.
If we think of “the bottom” from a well-being perspective, i.e. focusing not just on money but on those who describe themselves as being the most miserable, then another policy direction emerges. This group also suffers the most from mental health problems. If you could somehow eliminate mental health problems then you would cut the percentage of the population in misery by a third. Eliminating most physical illnesses would have a smaller effect. Of course you can’t completely eliminate either; but a government totally focused on increasing well-being would spend much more on improving mental health.
PRISONERS’ DILEMMA
The criminal justice system is an obvious case for well-being analysis. Of course, to some people the notion that a prison sentence is something that should improve the quality of life, or that prisoners are users of public services whose views should be sought by policy-makers is nonsense, even offensive. But unless we pay greater attention to the impact of custodial sentences and other penalties on people’s lives, the level of recidivism will prove extremely hard to reduce. And since the ultimate aim of the system must be to reduce crime levels, the degree to which we are operating policies which have the opposite effect is a serious policy failure.
Take the use of short prison sentences – say, up to a year. These have the following obvious economic and social effects:
- they disrupt family relationships, possibly also leading to the loss of somewhere to live
- they expose those sentenced to the companionship, in overcrowded jails, of others for whom crime is a way of life
- they may increase drug use
- they result in a loss of employment
- they provide an addition to the CV which is hardly an advantage in the jobs market
- they provide no opportunities for job training or the inculcation of “life skills”.
All these are likely to create new costs to society, when the punishment to the individual (the loss of liberty) is long over. Analysis of the impact on society’s quality of life, let alone that of the individual, has frequently demonstrated the harm this policy instrument causes. And yet, according to the Prison Reform Trust, of the 65,000 people sent to prison in England and Wales in 2017, 47% were given a prison sentence of six months or less.
HAPPIEST
1. FINLAND (7.769)
2. DENMARK (7.600)
3. NORWAY (7.554)
4. ICELAND (7.494)
5. NETHERLANDS (7.488)
6. SWITZERLAND (7.480)
7. SWEDEN (7.343)
8. NEW ZEALAND (7.307)
9. CANADA (7.278)
10. AUSTRIA (7.246)
11. AUSTRALIA (7.228)
12. COSTA RICA (7.167)
13. ISRAEL (7.139)
14. LUXEMBOURG (7.090)
15. UNITED KINGDOM (7.054)
16. IRELAND (7.021)
17. GERMANY (6.985)
18. BELGIUM (6.923)
19. UNITED STATES (6.892)
20. CZECH REPUBLIC (6.852)
BOX 3
THE WORLD HAPPINESS REPORT
The World Happiness Report, published in March 2019 by a group of American, Canadian and British economists, was the seventh of a series produced originally in support of a UN High-Level Conference on the topic in 2012. It ranks 156 countries in terms of happiness: the rankings are based on answers to the main life evaluation question asked in the Gallup World Poll. This is called the Cantril ladder: it asks respondents to think of a ladder, with the best possible life for them being a 10, and the worst possible life being a 0.
The economists then use their toolbox to estimate how much these scores can be explained by six objective and subjective factors: GDP per head, healthy life expectancy, and people’s answers to questions about social support, generosity, freedom from corruption and “positive and negative affect” – indicators of emotions such as enjoyment and laughter on the one hand, and anger and worry on the other. Overall, these explain about three-quarters of the differences in country scores.
The list of the top 20, given on the previous page, would at least seem to put paid to the notion that long winter nights make you miserable. By contrast to all those satisfied Scandinavians, the inhabitants of several southern European countries such as Greece and Macedonia come much further down the rankings. Another feature of the rest of the list is that Latin American countries come much further up the list than the economists would predict from their six key factors: the authors present some evidence that the strong family structures in those societies may have a lot to do with that.
But what politicians may find of most interest is the chapter in the latest report on links between happiness and political behaviour. Given the links between life satisfaction and economic factors, it is quite difficult to abstract from the economics to identify the happiness factor, but by looking nevertheless the evidence is powerful.
This suggests, perhaps surprisingly, that happy people are more likely to engage in the political process and vote (i.e. they do not simply lapse into comfortable apathy). It is well documented that happy people are more inclined to be generous and to volunteer, and political engagement seems to follow a similar pattern. Less surprisingly, people who are satisfied with their lives are more inclined to vote for incumbents. Unhappy people are more inclined to vote against them – or simply not vote at all.
That seems to be the case irrespective of whether the cause of their unhappiness is economic, political or personal, private grief or public anger: we are not good at making distinctions between them, it seems, when we come to vote. And looking at time series leads one to the conclusion that the share of the vote for incumbents varies more with average life satisfaction than with all the economic factors put together.
But what is most interesting is the exploration of the rise in populism in Europe and the US. According to the report, analysis suggests that unhappy people are more likely to vote for populists, and to believe that we need a “strong” (authoritarian) leader. The evidence comes, among other sources, from a series of investigations into votes in the US and French presidential elections, and the Brexit vote in Britain, where a mixture of life dissatisfaction or unhappiness and financial insecurity seem to have been powerful factors in the Leave vote.
But while these factors may explain why some people voted this way, how has the number of them risen? Put another way, since surveys suggest that life satisfaction has if anything been rising in these parts of the world, how can we explain the surge in populism? The best explanation seems to be that populists have got better at pushing the hot buttons that release dissatisfaction, and have profited from that. Not, to coin a phrase, a happy thought.
WHAT’S STOPPING US?
So now we have the data, why are they not having more impact on all our public policies? Well, one reason is that you can’t suddenly stop spending money on cures in order to spend more on prevention. You still have to deal with the effects of past failures, treating people for mental illness, arresting criminals, caring for those with chronic conditions even if they were at least partly self-inflicted. When resources are tight, making the necessary shifts from “cure” to “prevention” is particularly hard.
A second reason is the inbuilt scepticism about “subjective” data and a preference for “objective” evidence. And it is true that well-being responses may not be easy to interpret, as well as being subject to all sorts of influences it may be difficult to control for: whether it was raining when you asked the questionnaire, whether you had just had a family row or a big bill. But the surveys being conducted now are on a scale and over a time-frame that can smooth out temporary factors, and experience in interpreting the results is growing all the time.
A third reason is that politicians may be sceptical that such information really correlates with their prime objective, i.e. their chances of re-election, and may feel more comfortable relating directly to opinion polls on voting intention or monitoring objective economic data, on which there is a massive literature exploring the relationship with voting patterns. But the latest World Happiness Report may cause them to take more notice (see Box 3).
Overall, a better understanding of well-being data may give governments the confidence to make small shifts in their own behaviour, as well as seeking to influence the behaviour of others. At the very least, these new sources of information may help create a more disciplined approach to identifying and pursuing the ultimate objectives of policy, rather than focusing on intermediate targets (waiting times, exam results) whose pursuit may prove counterproductive.