


Covid-19 restrictions have provided the set for a unique experiment: what happens to air pollution when a large city grinds to a halt?
However, assessing the impact of lockdowns on air quality is not a straightforward exercise. Machine learning can help identify key trends in pollutant concentrations while controlling for confounding factors such as weather conditions - as our analysis of London air quality data shows.
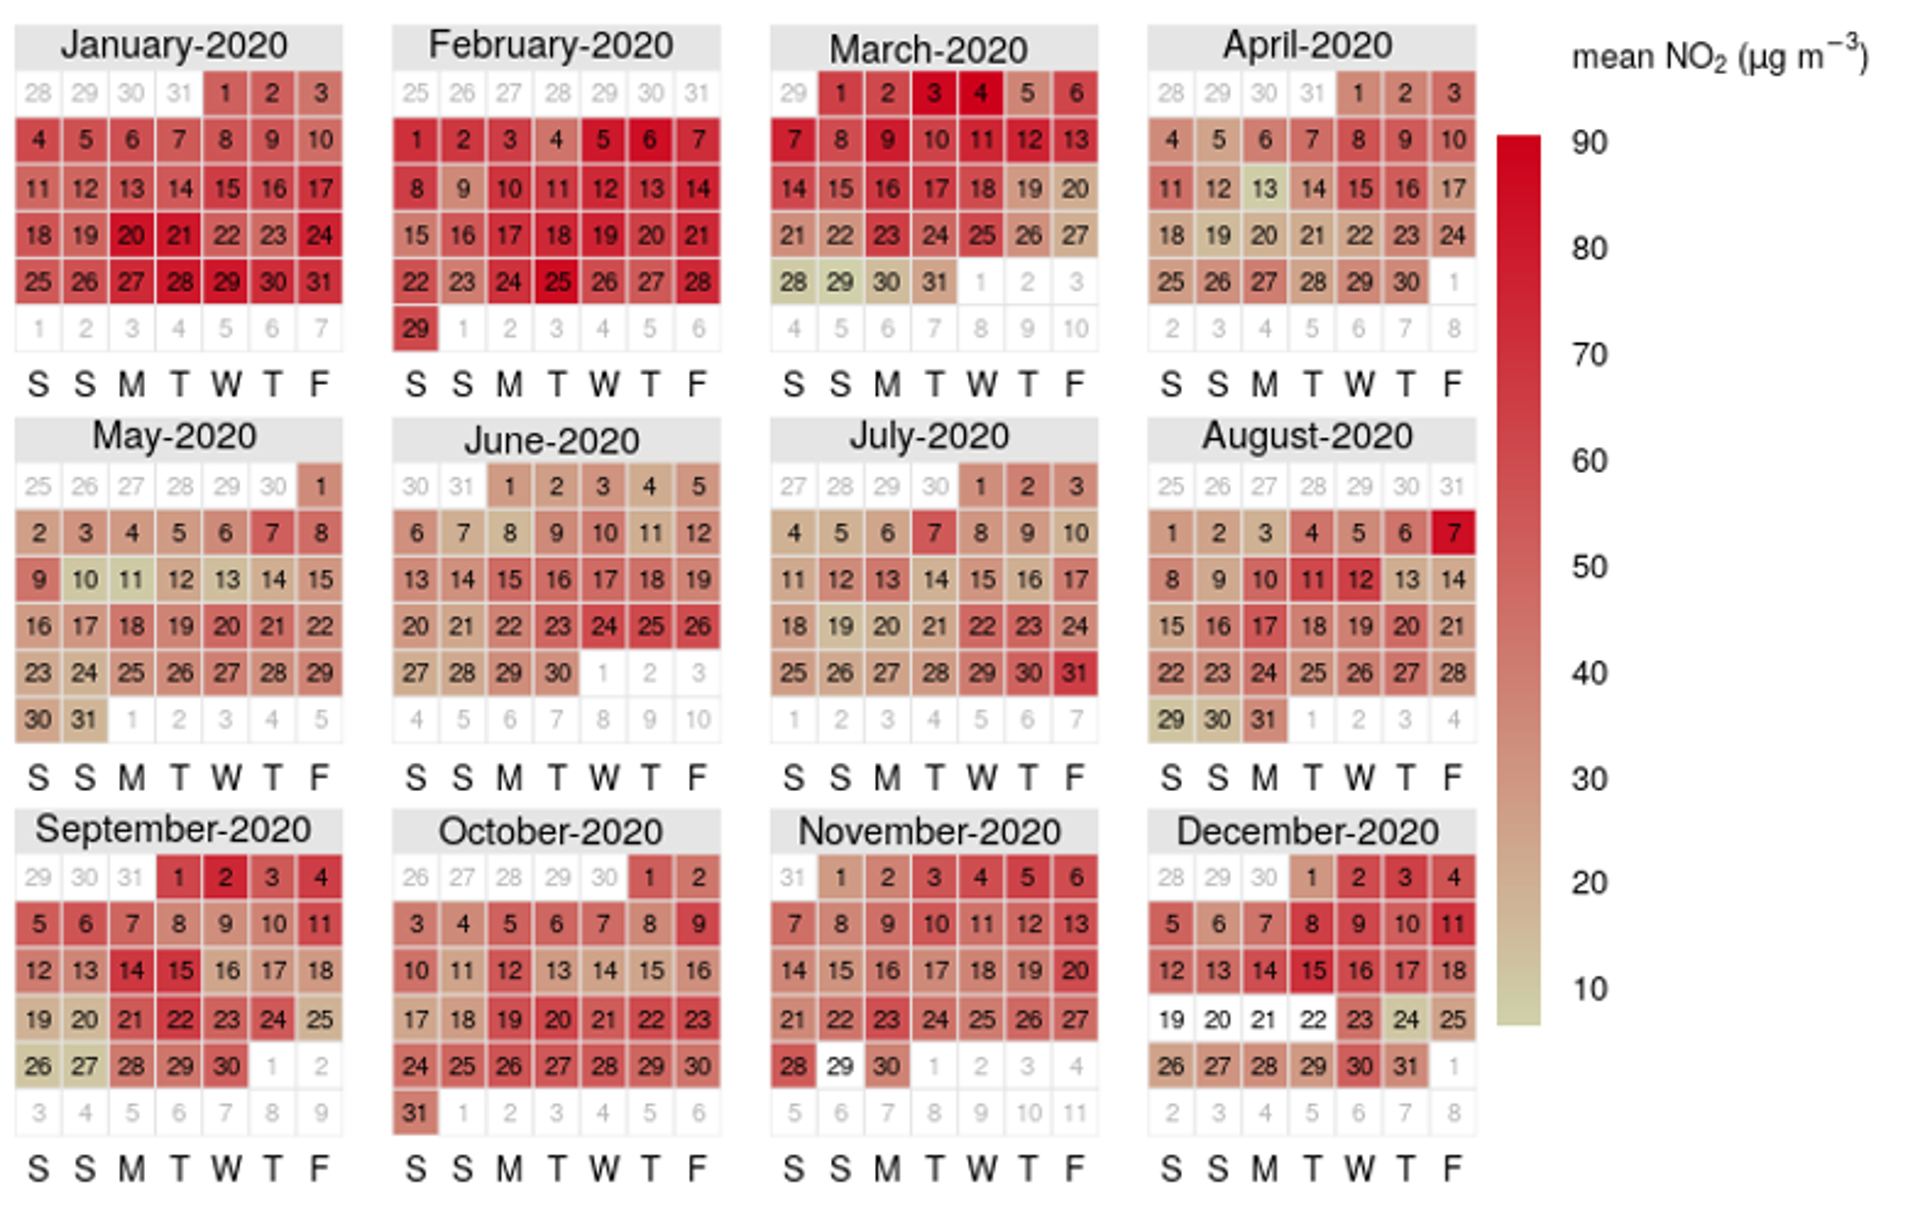
A first glimpse at London Nitrogen Dioxide (NO2) concentrations suggests that lockdowns had a material effect on air quality. As can be seen from Figure 1, NO2 levels significantly decreased after the first lockdown was put in place in late March 2020, likely as a result of reduced emissions from road traffic, and stayed low over the summer. NO2 then increased again in autumn and winter but remained lower than it was in the first months of the year.
However, several confounding factors are at play, so one should be careful not to interpret the apparent correlation between lockdowns and better air quality as a proof that mobility restrictions indeed caused the observed reduction in pollution levels.
Figure 1: NO2 daily concentrations on London’s Marylebone Road
Source: Frontier analysis of AURN data
How weather affects air quality
Weather conditions are probably the most significant of these other factors. Figure 2 shows mean NO2 concentration (measured at London Kensington) for the 2015-2019 period as a function of wind speed and direction. Each circle represents a five knots increase in wind speed. As one can see from the figure, NO2 tends to accumulate in calm conditions, while higher wind speeds (particularly when blowing from the west) favour the dispersal of NO2.
In addition to wind, other atmospheric factors can affect air quality. For example, rain usually washes away pollutants, while colder weather tends to trap them closer to the ground, thus worsening overall air quality.
Figure 2: Mean NO2 concentrations as a function of wind speed and direction
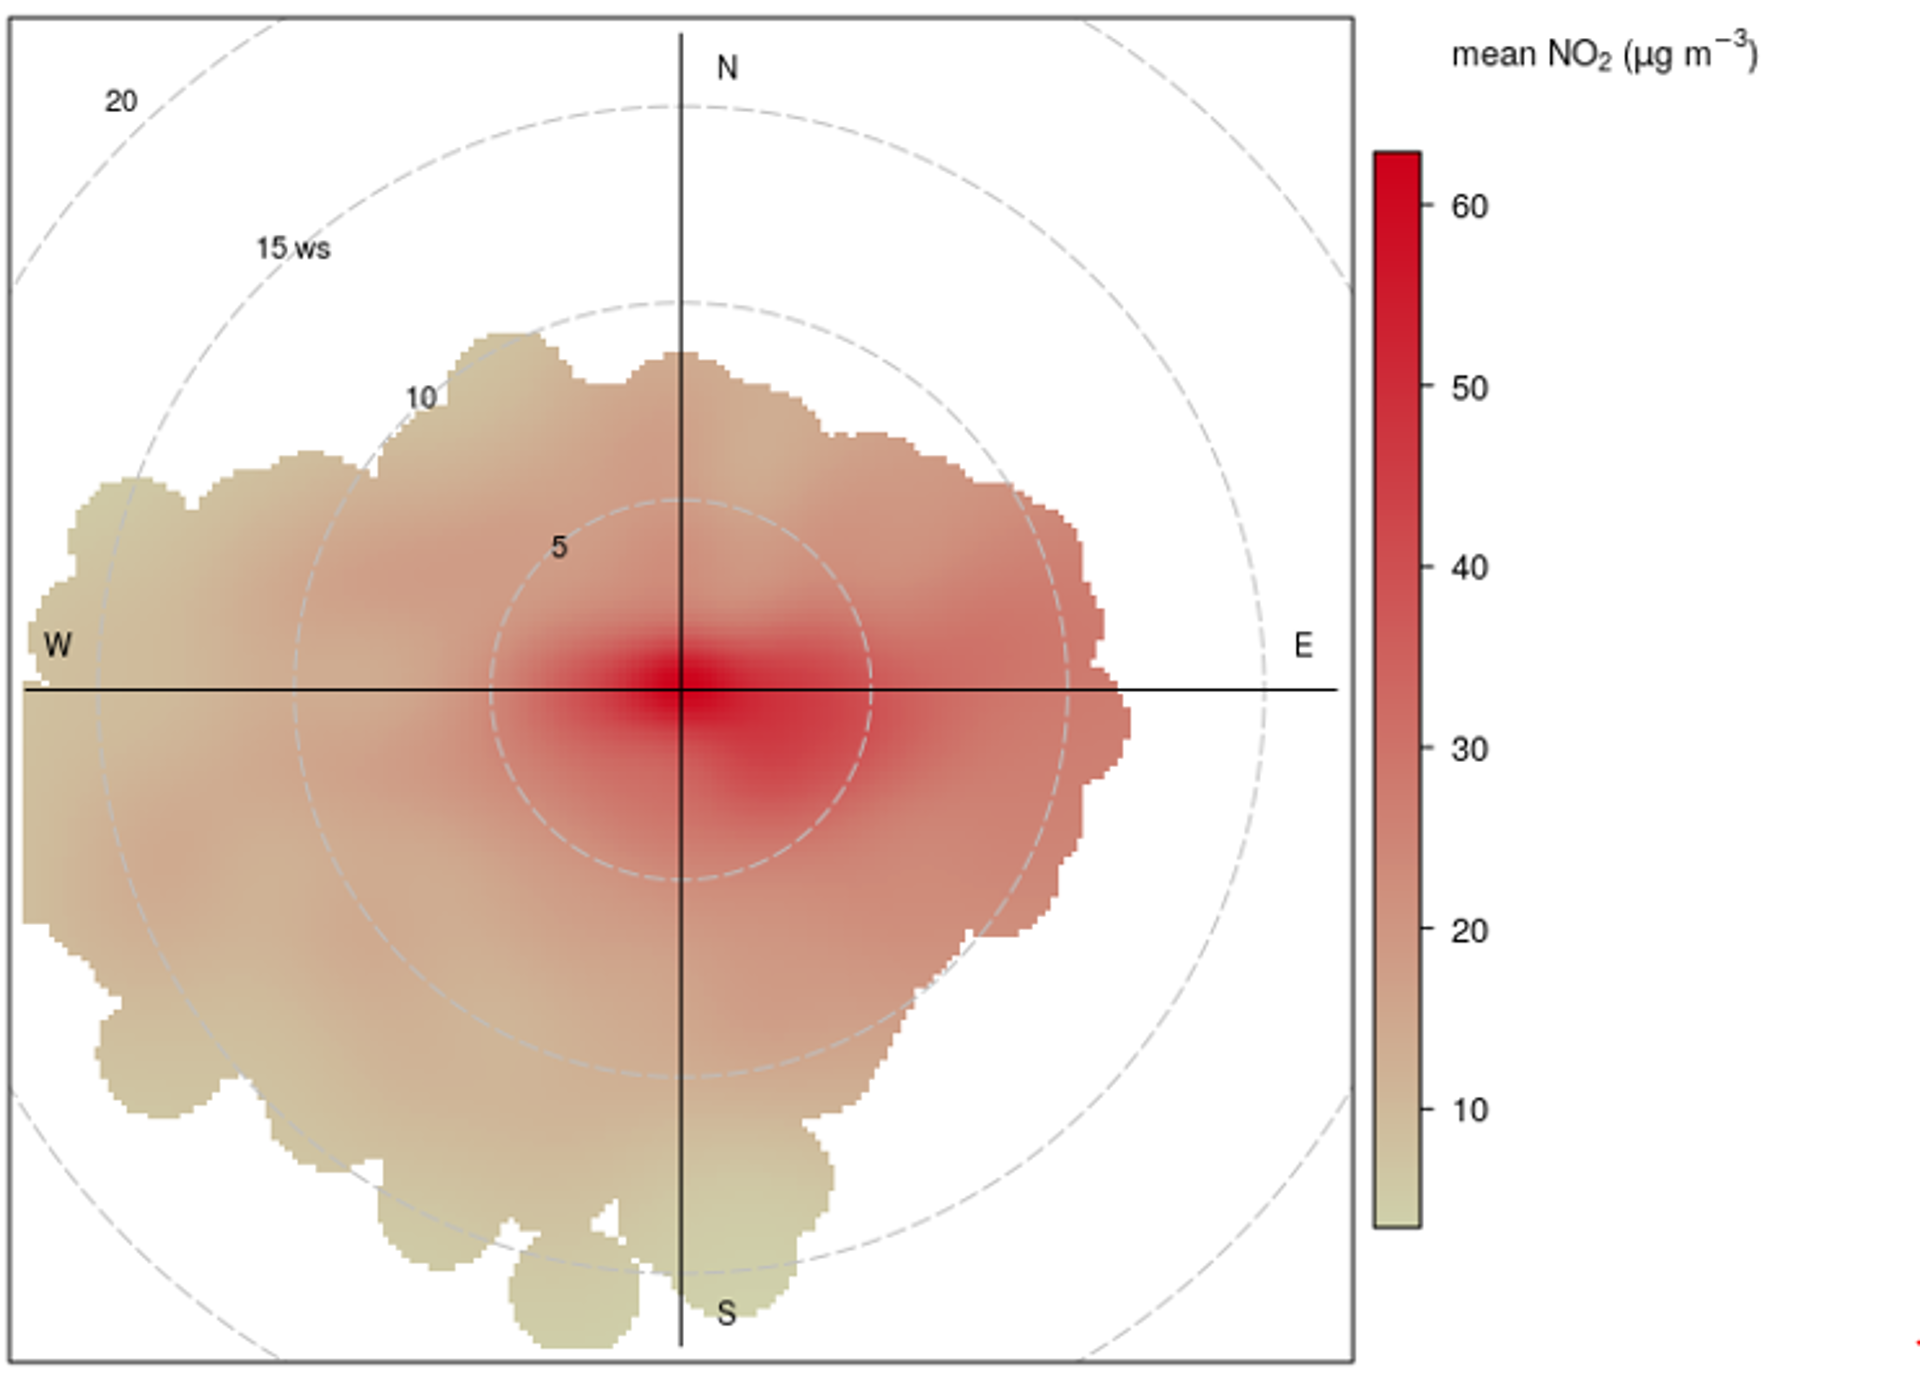
Source: Frontier analysis of AURN and NOAA data using the ‘openair’ r package
For these reasons, weather conditions should be taken into account when trying to assess the impact of a policy on air quality. Failing to do so introduces the risk of attributing to policy (lockdowns in this case) changes in air quality that would have naturally occurred given different weather conditions.
Machine learning can help isolate the impact of lockdowns on air quality
In order to assess the causal impact of lockdowns on London’s air quality one would ideally need to compare the actual observed pollution levels to those that would be recorded under the same weather conditions if it was business as usual. This boils down to creating a credible counterfactual that shows how pollution levels would have evolved absent the lockdown.
We have created our counterfactual using a random forest machine-learning model developed by researchers at the University of York (Grange, 2020) and made available to the public through the ‘rmweather’ package on the r statistical software.
The model is trained using several years of London historical data on pollution levels and weather conditions collected by air monitoring stations that are part of the UK Automatic Urban and Rural Network (AURN). For each monitoring station, our model predicts pollutant concentration for each hour in 2020 based on observed past concentrations, associated weather conditions and other trends and cyclical effects.
The model predictions should reflect seasonal and meteorological variations in pollution levels, thus allowing us to attribute differences between predicted and observed levels to lockdowns rather than meteorological effects.
London’s NO2 levels in 2020 were much lower than projected
Figure 3 compares average expected and observed NO2 concentrations in London over the course of 2020. Predicted concentrations closely track observed concentrations in January, February and early March. This shows that our model is able to anticipate NO2 quite precisely under business-as-usual conditions. We then observe a divergence between predicted and actual NO2 levels starting from late March. The gap widens in April and May. Over the summer, projected concentrations remain significantly lower than observed NO2 levels. Interestingly, we see the gap narrowing in autumn, thus suggesting that the second lockdown, which was in place during November 2020, had a minor impact on air quality compared to the first lockdown.
Figure 3: Average daily NO2 levels in London - predicted vs observed concentrations
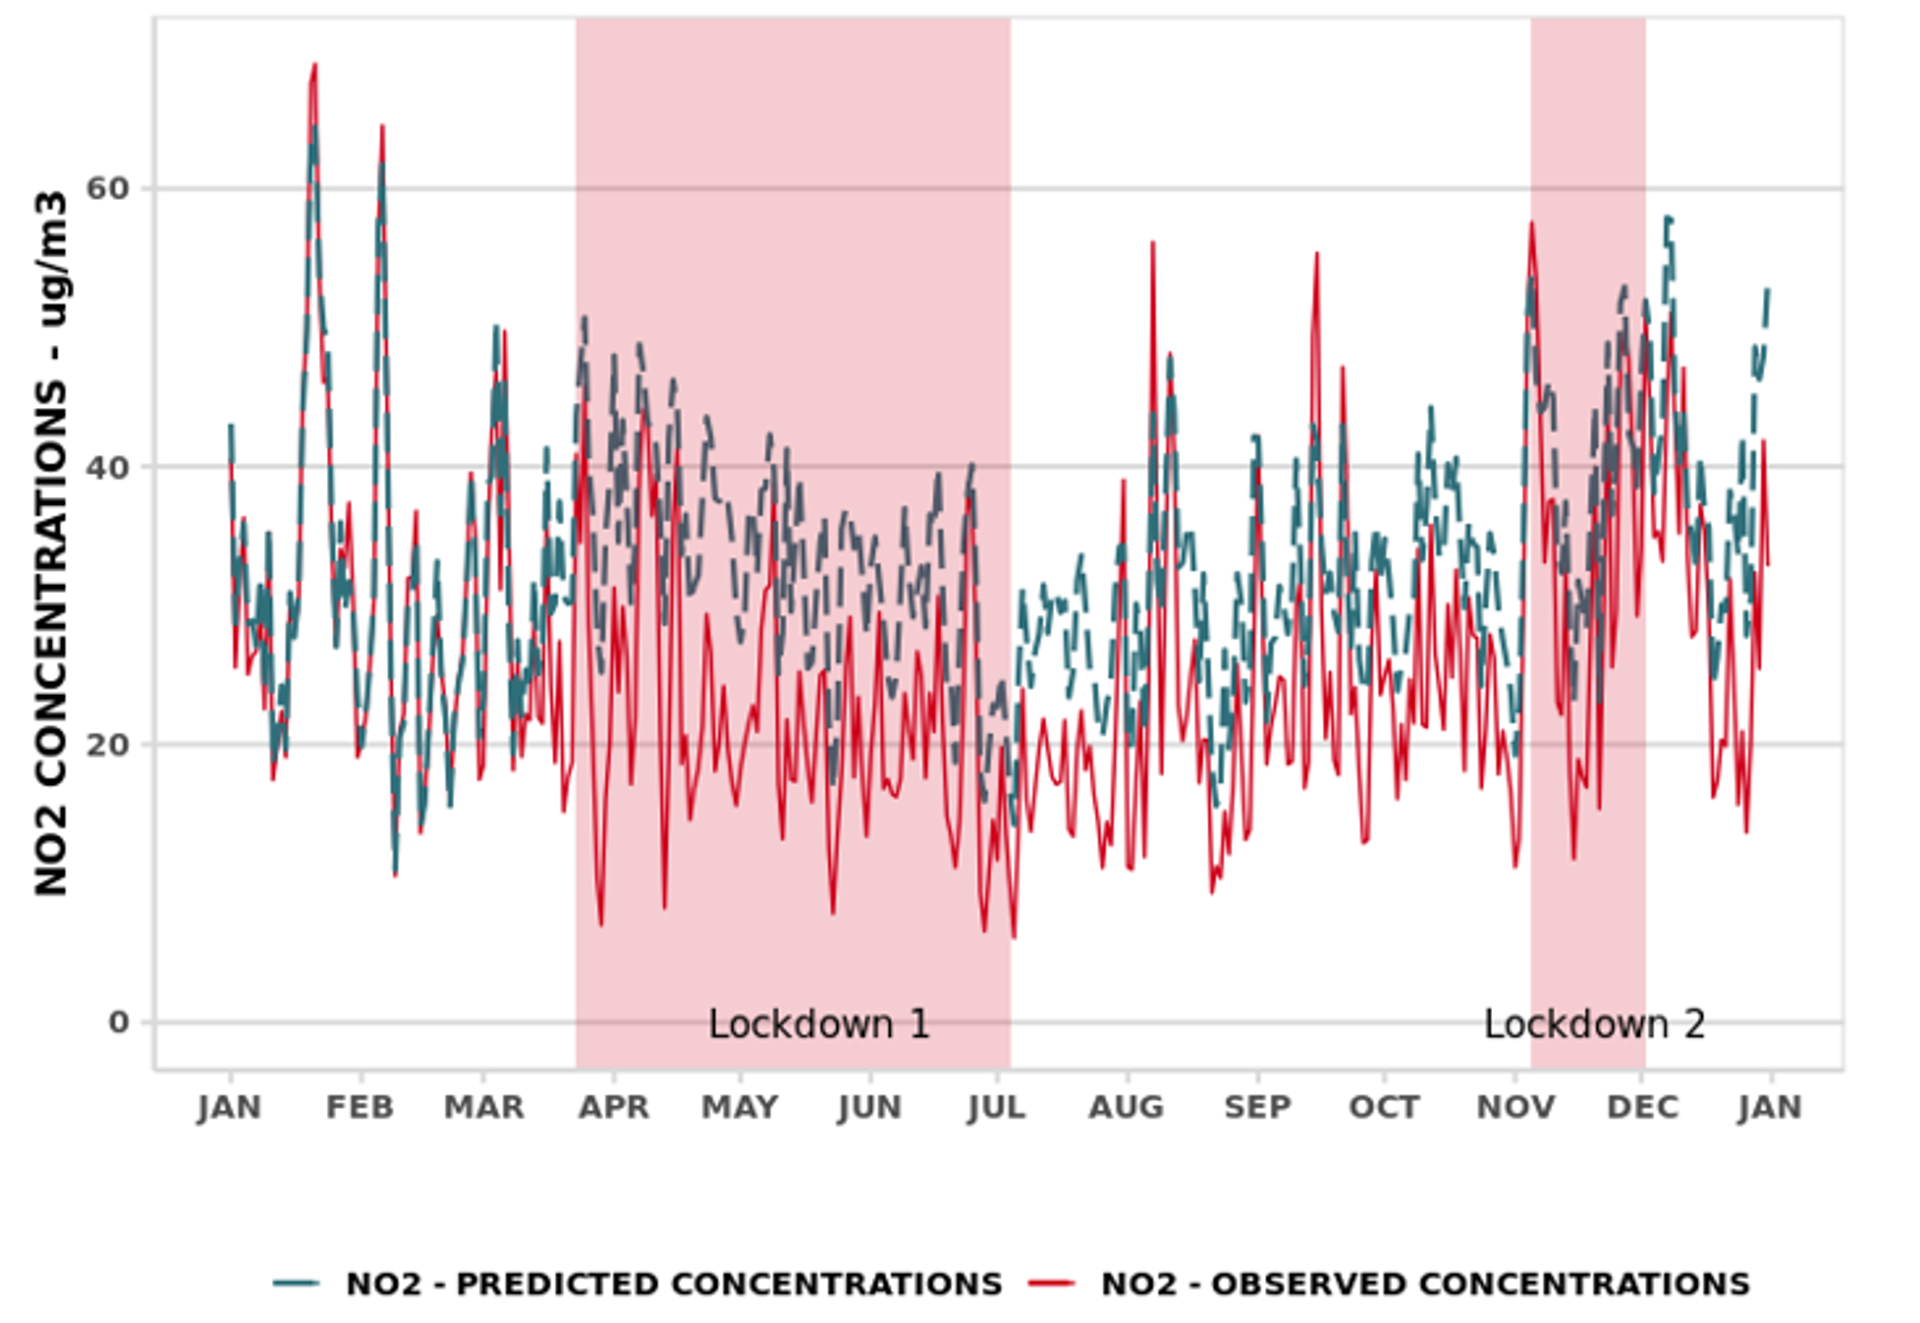
Source: Frontier analysis of AURN and NOAA data using the ‘rmweather’ r package
To better estimate the impact of restrictions on air quality, we have computed the average monthly percentage difference between predicted and observed NO2 levels. As can be seen from Figure 4, NO2 was up to 40% lower than business-as-usual levels in May. Overall, we found that NO2 pollution levels were 38% lower than what the model projected between late March and the end of June. We then found a 30% difference between July and September. Finally, for the last three months of the year, NO2 was 20% below the predicted concentrations.
While there is still little evidence on the impact of the second wave of restrictions on air quality, our results for the March-May period are in line with previous studies. For example, Jephcote and co-authors (2020), using a similar approach and looking at the whole of the UK, estimated that NO2 concentrations were 38% lower during April compared to a business-as-usual scenario.
Overall, our results suggest that the second lockdown was less effective than the first one in reducing NO2 pollution. There can be several explanations for this. For example, a look at TomTom mobility data suggests that the second lockdown led to a significantly smaller reduction in traffic than the first. Indeed, during April and May TomTom reported 49 days with at least 50% less traffic than in the same period in 2019, but only four such days in November.
Colder weather during the winter period is also a possible explanation. A lot of people were working from home and so used more heating than in the spring and summer months. This suggests that if remote working becomes increasingly common, lower NO2 emissions from traditional sources such as road transport might at least in part be offset by higher emissions from other sources. The upshot would be smaller overall improvements in air quality than expected.
Figure 4 Monthly change in NO2 concentrations in London
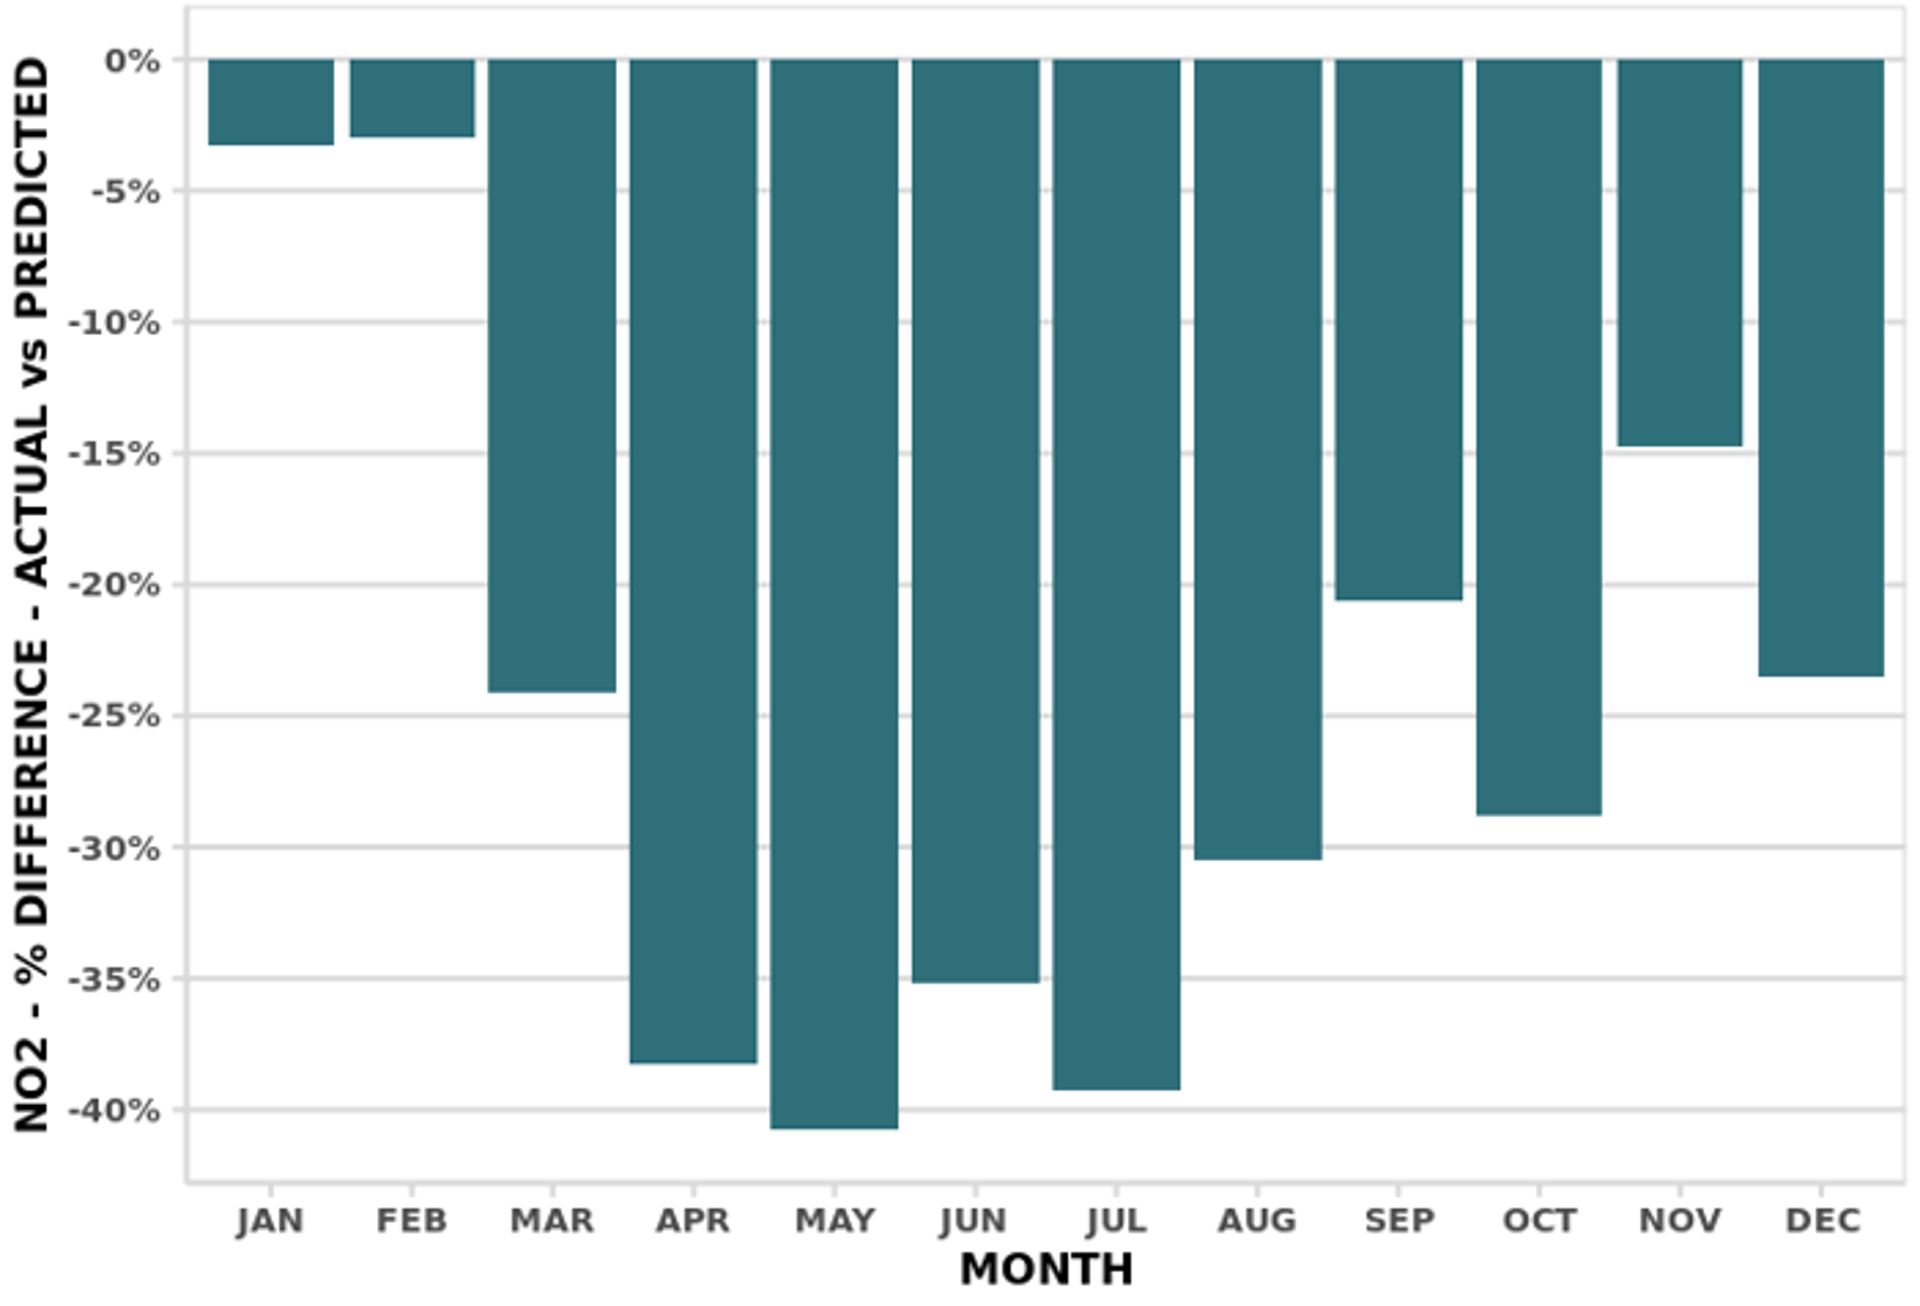
Source: Frontier analysis of AURN and NOAA data using the ‘rmweather’ r package
The other side of the coin: increased O3 concentrations during 2020
While stratospheric ozone plays a key role in shielding us from the sun's harmful ultraviolet rays, ground-level ozone (O3) is harmful to human life, vegetation and the environment. Ozone pollution can cause health problems such as chest infections, headaches and eye irritation as well as aggravating pre-existing conditions such as asthma. It can also damage leaves, reducing crop quantity and quality.
O3 is a secondary pollutant. This means that it is not directly emitted from a source. Instead, it is formed when heat and sunlight cause chemical reactions between NOx (NO and NO2) and Volatile Organic Compounds (VOC). Interestingly, O3 can be degraded by the very same compounds (NOx) by which it is formed. This shows that the relationship between O3 and NOx is complex and generally non-linear. In particular, a decrease in NOx can lead to an increase in O3 as the formed ozone is subjected to less degradation. This seems to have happened during the lockdown period in London, where O3 levels increased markedly.
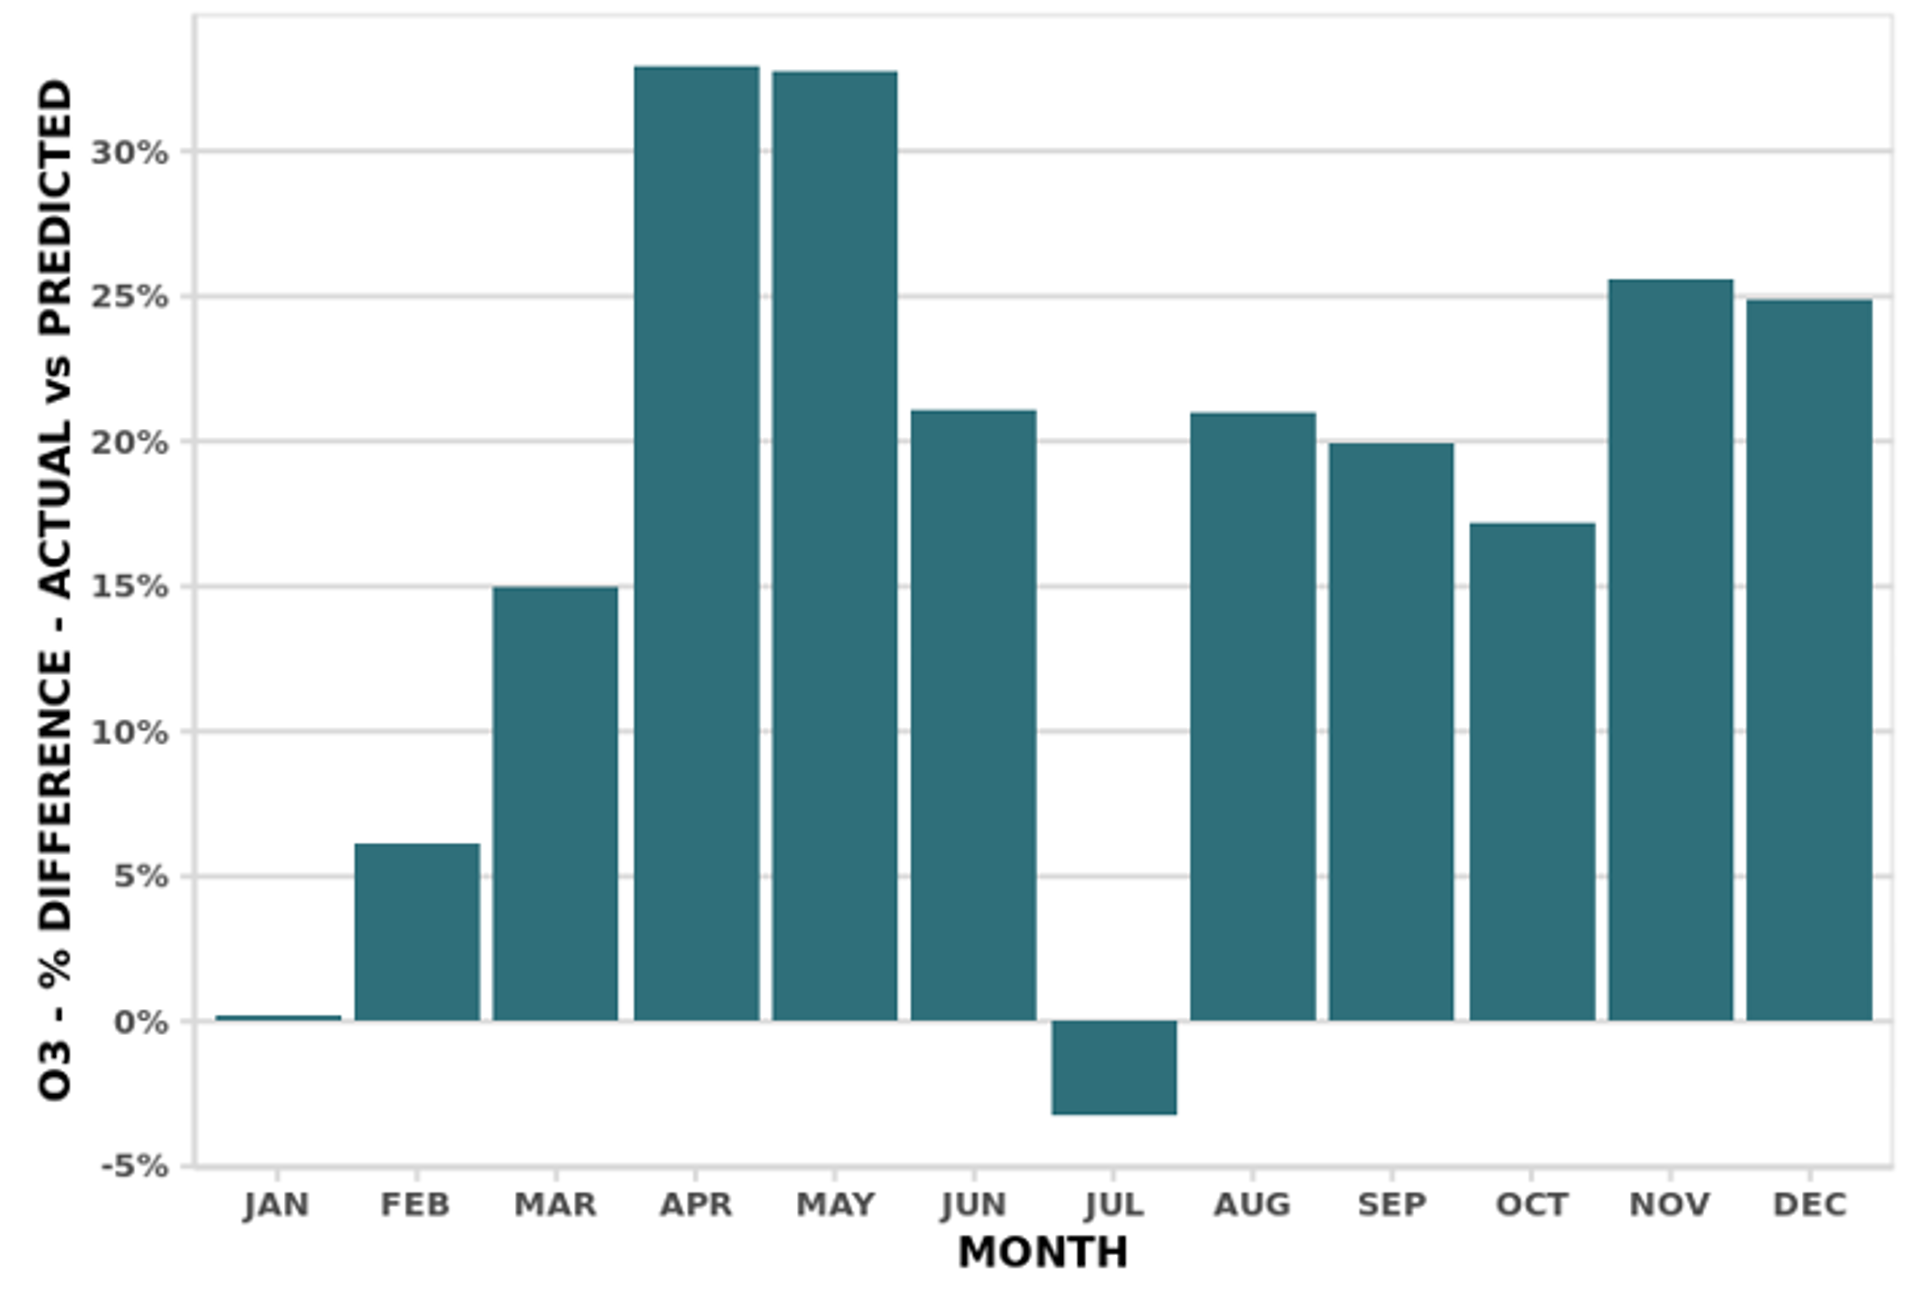
Similar to what we have done with NO2, we have projected O3 concentrations assuming business as usual and compared predicted and observed concentrations. As can be seen from Figure 5, observed O3 levels have been significantly higher than expected, reaching peaks of nearly +35% during the first lockdown period.
Increases in O3 were observed in several cities across Europe during 2020. A study by Grange and co-authors (2020) that analysed data from air pollution monitoring sites in 34 European countries between February and July 2020 estimated that O3 concentrations were between 21% and 30% higher than under business-as-usual scenarios.
COVID-19 lockdowns can be seen as an analogue of how air quality will respond to future reductions in emissions from vehicles. These results hence suggest that as we reduce levels of nitrogen dioxide by cutting diesel and petrol emissions, there could be a corresponding increase in O3 that potentially offsets public health gains from lower NO2. It is therefore important that O3 and its relationship with NO2 are explicitly considered in any air pollution abatement strategy.
Figure 5 Monthly change in O3 concentrations in London
Source: Frontier analysis of AURN and NOAA data using the ‘rmweather’ r package
Could machine learning help in the fight against air pollution?
As the UK gradually emerges from the pandemic and vehicles once more congest the roads, air quality concerns are rising back up the policymaking agenda. In London, a number of flagship air pollution reduction policies are due to be rolled out over the course of 2021. These include the expansion of the capital’s Ultra Low Emission Zone (ULEZ) as well as changes to the existing Low Emission Zone (LEZ) and the inner-city congestion charge. As these and other policies are introduced in London and elsewhere, policymakers will need to assess the effectiveness of their interventions.
This exercise is not in principle different from our assessment of the impact of Covid-19 restrictions on air pollution, as both require the use of data science methods that can separate the effects of a policy from those of confounding factors such as the weather. Our analysis has provided an example of how this could be done in a robust way by applying advanced analytical techniques to the rich data collected through the UK’s air quality monitoring network . Of course, measuring the impact of these policies on pollution levels is not the full story: the environmental benefits of any measures must be weighed against any economic costs, as Londoners concerned about the impact of the ULEZ on the cost of traversing the capital would attest. Nonetheless, machine-learning methods similar to the one we used to prepare this article may prove a useful tool for policymakers looking to decide whether the economic pain will generate real environmental gain.